
Multiple time frame analysis is the concept of using in particular higher time frames to identify the bigger trend as well as using lower time frames for better entries and a much accurate timing of the market. We have to establish a general rule of the fact that higher time frames have more significant than lower time frames.
A weekly chart is going to have more significant levels than a daily chart, and a daily chart is going to have more significant levels than a 4h chart and so on and so forth. We can continue to drill down all the way into a tick chart, but this is a general rule that we just have to accept because it’s have proven over time that a swing and a higher time frame will almost always be affecting the swings on the lower time frames. Trading along with the higher time frame can increase your chances of success in trading because that’s where the smart money usually operates in the market.
The multiple time frame analysis will give you a better perspective on what it’s really happening in the market. For example, the higher time frame can give us indications of what would be happening in the market and especially what will be happening on the lesser time frames. This strategy post will show how you can look at the higher time frame charts to judge trends and potential turning points and then move down to an intraday time frame in order to assess where to make an entry. This is a very common strategy and a concept that is readily available to any trader who wishes to apply more advanced trading strategies.
Applying Multiple Time Frame Analysis to the 4 Hour RSI Bollinger Bands Strategy
Although the 4 Hour RSI Bollinger Bands Strategy has proven to perform quite well by applying the multiple time frame analysis concept we can have a better framework format to trade upon. A top-down approach to multiple time frame analysis is to first start with the higher time frame and work your way down to lower time frames. Basing your trading decision off of multiple time frames requires the use of at least 2-3 different time frames. The4 Hour RSI Bollinger Bands Strategy with multiple time frame analysis uses 3 time frames as follows: Daily, 4H, and 1H time frames. When you combine together three different time frames the odds of being on the right side of the market increases.
Understanding Multiple Time Frames Analysis
Starting with the Daily time frame, we can look first to assess the line of least resistance or in other words to dominant trend. If we’re trading above the upper Bollinger Band and the RSI Indicator is in overbought territory the trend is about to reverse, however, if the RSI is not greater or equal than 70 most likely we’re in a strong bullish trend and it’s best to wait for the RSI to turn overbought. The same holds true in reverse if on the daily we’re trading below the lower Bollinger Bands.

Going forward, we’re downgrading our multiple time frame analysis to the 4h chart and wait to see the same price action like in the Daily time frame. If on the Daily time frame we’re overbought and above BB we wait for the 4h chart to turn overbought and break above the upper band or if we’re oversold we wait for the 4h chart to turn oversold.

In Figure 3 we have the 1h time frames, which we’re going to use to time the market and entry our trades. All we have to do is to wait for the Bollinger Bands to turn flat and enter short at the market as soon as we break below the lower Bollinger Band if the 4h and the Daily time frame are in overbought conditions. If the 4h and the Daily time frame are in oversold conditions we’re going to enter long once the market breaks above the upper Bollinger Bands.

Multiple time frame analysis requires a lot of practice because often time different time frames can produce conflicting signals. However, if you have straight rules and if you look at each time frame for specific patterns you can have a much clearer view of the overall price action.
Let’s take another example and see how we can use differently the concept of multiple time frame analysis. We’re going to use the Daily chart to take the direction of the trend if we break below the BB we enter into a bearish trend and conversely if we break above the BB we enter into a bullish trend.

Downgrading the charts to the next time frame – the 4H chart; we look for a retracement into the middle band before going down to the 1h chart for fine tuning our entry.
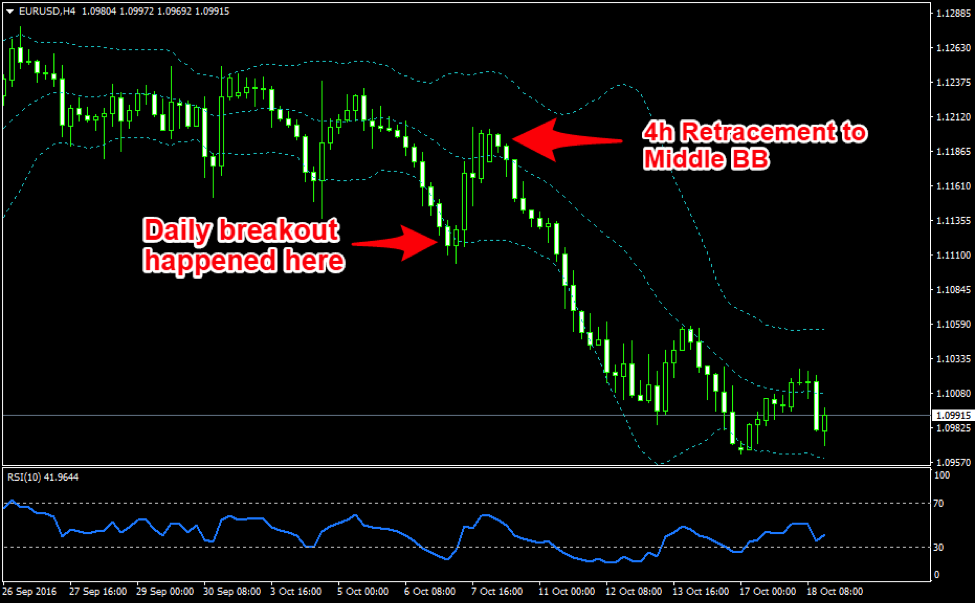
On the 1 Hour chart, we look for both the RSI to be in overbought condition as well as for the price to either touch or break the upper band. The idea behind this multiple time frame analysis is that the Daily chart will give us the market bias and with the help of the 4h and 1h chart we can better time the market.

Regardless of the strategy that you might be using right now, you can certainly increase your probability when you apply multiple time frame analysis to confirm your trading signals. If you trade of the 4H chart, then use the daily chart to confirm that you are trading in line with the bigger trend. Then use the 1 hour chart to time your entry. This is a powerful method that you won’t find anywhere else. Comment below to share with us your success in using the Multiple Time Frame Analysis.
Claim Your $60 No Deposit Bonus Here
All you need is to have your live account verified!
Of course, you need to open a live account...
2 Brokers that we like A LOT!
USD30 from each Forex Broker Below.
Both Forex Brokers have excellent rating!
We use both of these brokers and proudly promote them!
NOTE: Not all countries qualify for these bonuses. Terms and Condition Applies.Other Analysis Today

i have found that forex trendy is one of the best tools out there for multiple time frame analysis http://pipmill.com/forextrendy
Zumur,
Thank you for sharing. Yes… the Forex Trendy site is a good tool for any trend trader. Thanks again.