
If you’re a trader who likes to get into position fast and get out of position even faster, then the 1 Minute Forex Scalping Strategy using the CCI and the TMA Slope MT4 indicator might just be the type of strategy that you will love. The CCI indicator or the Commodity Channel Index is an oscillator that can be used to spot possible overbought and oversold conditions in the market as well as identifying the direction of price movement. On the other hand, the TMA Slope MT4 indicator is a very complex customizable momentum indicator.

The 1-Minute scalping strategy will give you the precision you need to trade when dealing with a faster time frame such as the 1-minute TF. It also has a high level of accuracy and it’s a very profitable trading system.

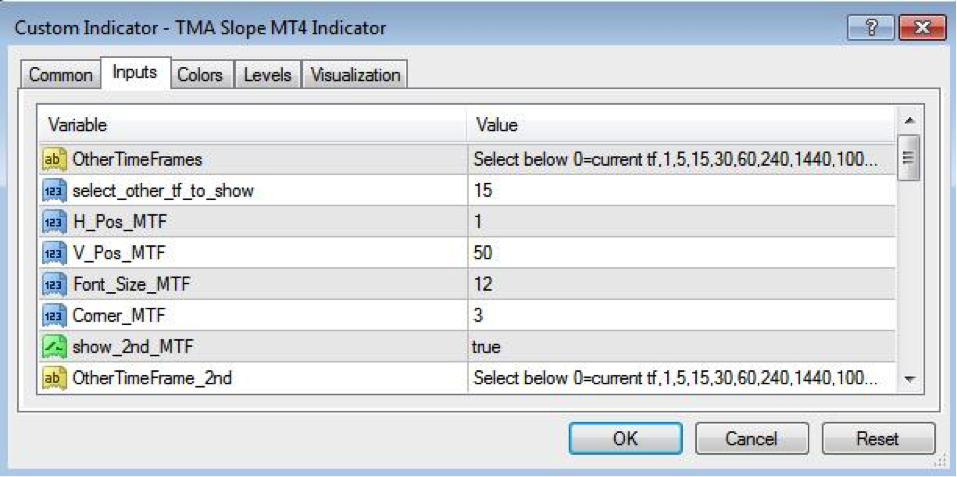
TMA Slope MT4 Indicator Settings
The preferred settings for the TMA Slope MT4 indicator are the default settings with the exception of the time frames based on which the TMA Slope is constructed. The TMA Slope is based on 3 different time frames which are displayed on the bottom left of your chart. Because the strategy is applied on the 1-minute time frame we’re going to use very short-term TFs, as follows: 1-Minute, 5-Minute and 15-Minute. Click here to download the TMA Slope MT4 Indicator,
The TMA Slope looks similar with the MACD histogram, but it’s a smoother version and with few “oscillations” above or below the zero line which it makes it easier to define the trend and the right side of the market. Another important feature of the TMA Slope MT4 indicator is that it has a built-in function to display the current market environment: Buy only (bullish trend), Sell only (bearish trend) or ranging.

The preferred settings for CCI indicator are the default settings as shown in Figure 3. The CCI indicator is used as well as for helping you getting in a trade, but as well as managing the trade. You can just use the CCI Indicator that comes along with the standard MT4 trading platform.
1 Minute Forex Scalping strategy using the CCI and TMA Slope MT4 indicator
The centerpiece of the 1-minute scalping strategy is the TMA Slope indicator which is the first indicator that we’re going to check out before entering a trade. The TMA Slope is very easy to read and interpret because it has a color code that changes with the trend direction. Near the zero line the TMA Slope is always gray, indicating ranging conditions, but when a trend develops the TMA Slope changes the color to green (for bullish trend) and red (for bearish trend) and as the momentum of the trend increase the color intensity will change to signal the strength of the trend. Without further ado, these are the buy and sell signal rules of the 1-minute scalping strategy:
- Buy signal: Buy at the market when the TMA Slope is green and the CCI is below -100. Use a protective stop loss of 10 pips and take profit once the TMA Slope turns back to gray.
- Sell signal: Sell at the market when the TMA Slope is red and the CCI is above 100. Use a protective stop loss of 10 pips and take profit once the TMA Slope turns back to gray.
Trade Example
In Figure 4 we have the EUR/USD 1-minute chart and buy trading opportunity is highlighted. It’s important to note that despite the TMA Slope turning green we still have to wait until the CCI drops below -100 before initiating a trade. Not every time you’ll have both the TMA Slope and CCI is confirming your signal at the same time and it’s mandatory to have patience. The TMA Slope MT4 indicator is very practical as in the bottom left of the window will indicate what type of signals you should take: Buy only which is our case.

In Figure 5 we have the EUR/USD 1-minute chart and short trading opportunity is highlighted. The first attempt for a short trading opportunity was when the TMA slope turned red however; we didn’t have the confirmation from the CCI indicator. We can note that the second time when the TMA slope turned red it took quite a while until the CCI to get above +100, this helped us to avoid the price range and have a better timing. As the trend developed we can note the color intensity of the TMA slope increases, which gives us more information on the trend strength that can ultimately help us better manage our trades.

In Figure 6 we have the EUR/USD 1-minute chart and this time no trading opportunity is presented. The TMA Slope is a very complex indicator that knows to properly read the market conditions and when we have a very tight price range it will correctly identify that and keep you out of the market.

Claim Your $60 No Deposit Bonus Here
All you need is to have your live account verified!
Of course, you need to open a live account...
2 Brokers that we like A LOT!
USD30 from each Forex Broker Below.
Both Forex Brokers have excellent rating!
We use both of these brokers and proudly promote them!
NOTE: Not all countries qualify for these bonuses. Terms and Condition Applies.Other Analysis Today