
Price action signals are important to any trader, but price action trading without knowledge of these 10 price action signals will result in confusion, frustration, and ultimately failure. This article will help you develop your understanding of price action trading by learning about the ten essential price action trading signals every trader should know and understand.
Actionable Tips

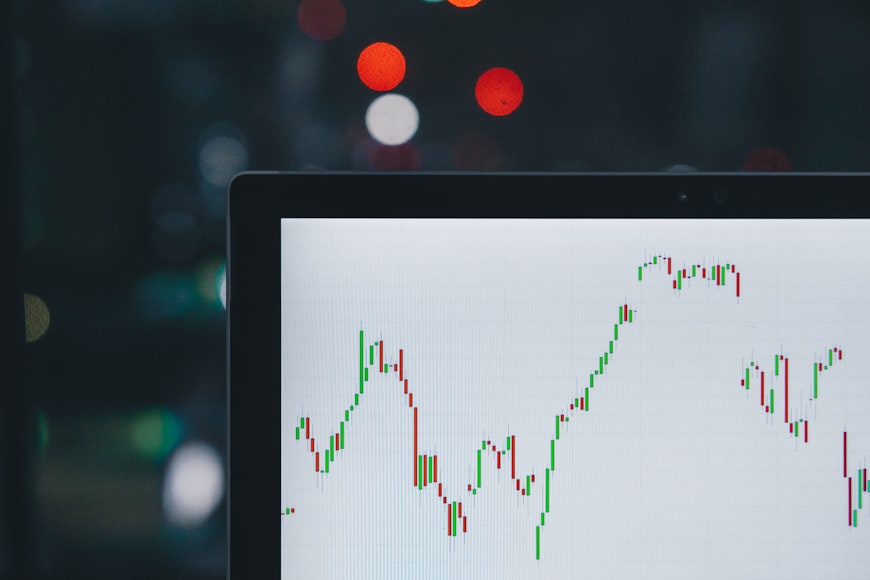
- When a bullish (green) candle forms, you can look for an uptrend to continue or expect a retracement.
- A bearish (red) candle can signify that the price is going to retrace and the uptrend may end soon.
- If there are multiple bullish (green) candles in a row and they start to get smaller, it’s time to be cautious because the trend may be ending soon and there might be a retracement coming soon.
How To Use Price Action To Win Trades
Price action trading is a form of technical analysis that relies on the study of charts to make predictions about future prices. The word action comes from the fact that it analyzes what traders do and not what they say. Price Action traders believe that all you need to trade profitably are two pieces of information:
- the current market price, and
- where the next supply or demand level is.
The Best Candlestick Patterns
A candlestick is a single bar on a price chart that represents the opening and closing prices of a security over a specific time period. It can be used to determine trends in the market, as well as the sentiment of investors. Some of the more popular patterns are
- Shooting Star: A small body with long upper shadow and short lower shadow, indicating that buyers pushed prices up but were overpowered by sellers who sold at higher prices.
Scanning For Opportunities
Traders will use different techniques to find opportunities. Some traders focus on the technicals, while others are more concerned with the fundamentals of an asset. When scanning for opportunities, it is important to be aware of specific price action signals that can indicate a possible reversal in the current trend.
Doing Technical Analysis – An Introduction

Technical Analysis, or TA, is the process of analyzing historical data to identify patterns that can be used to predict future market movements. It has been around for centuries and has been used by traders ever since. There are many different forms of technical analysis and they each have their pros and cons.
The Anatomy Of A Chart
A chart can be a powerful tool for traders. It not only illustrates the current state of an asset, but also provides valuable information that can be used to make trading decisions. Learning how to read a chart is an important first step in the process of becoming a successful trader.
Supporting And Resistance Zones

Support and resistance zones are two types of places where prices come to rest. Support is a zone where the price has been pushed up from below, and resistance is a zone that acts as a ceiling for prices, preventing them from going higher. These zones are significant because they offer points of reference for traders and can signal future trends.
Start by looking at the current trend.
Basic Chart Patterns
The ’head and shoulders’ pattern is a very common reversal pattern in which the asset will form three consecutive peaks followed by a lower fourth peak that forms the head of the pattern. The shoulders are formed by the two valley points between each of these peaks, and the neckline is then drawn from the lowest point of one shoulder to the highest point of another shoulder.
Specific Chart Patterns

The Harami is a two candlestick pattern that offers similar information to the engulfing pattern. You can identify a Harami when the second candle has a lower close than the first, but there is no overlap between these two candles.
Tools To Help You Trade Better
Price action is a term used in technical analysis to describe the relative change in the value of a security. While it can be intimidating, price action trading is just one way to get an edge over your competition.
The Sniper Trading System
If you like to learn how to anticipate market movements and stop using lagging indicators , then you will absolutely LOVE our Sniper Trading System.
Enter Your Name and Email Below to Download Now...
Claim Your $60 No Deposit Bonus Here
All you need is to have your live account verified!
Of course, you need to open a live account...
2 Brokers that we like A LOT!
USD30 from each Forex Broker Below.
Both Forex Brokers have excellent rating!
We use both of these brokers and proudly promote them!
NOTE: Not all countries qualify for these bonuses. Terms and Condition Applies.Other Analysis Today

