
The 4 Hour RSI Bollinger Bands Forex Trading Strategy will be the perfect strategy if you do not want to be stuck in front of your computer all day long. Bollinger Bands are a great way of trading Forex instruments. Specifically, this strategy that uses a combination of a trend following indicator – Bollinger Bands; and a momentum indicator – RSI; is pretty good for Forex currency trading more than other items because of the way the Bollinger Bands indicator contains the prices inside an upper limit band and downward limit band. The 4 Hour time frame is the ideal chart to be traded because it’s short enough to encompass the intraday swings and long enough to include the more relevant price action that happens on the bigger time frames where the smart money usually operates.

The Bollinger Bands can be used to analyze the trend structure as well as finding trend reversals that lead into great new trends. The beauty of the Bollinger Bands is that they automatically adjust to the market conditions, providing you with dynamic support and resistance levels. The Bollinger Bands will expand and contract as the market fluctuates between periods of high volatility and low volatility.
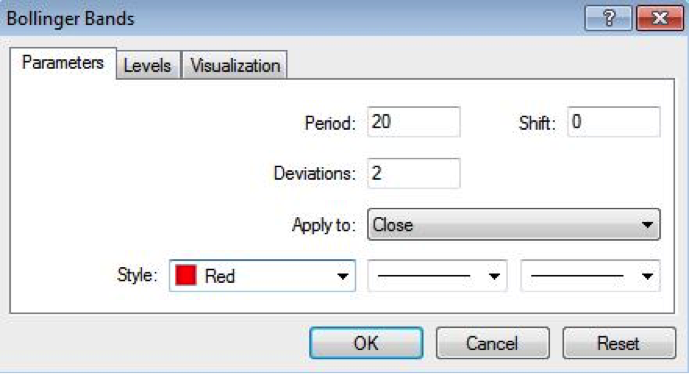
Bollinger Bands Indicator Settings
The preferred settings for the Bollinger Bands Indicator are the default settings. We’re going to use a 20 periods simple moving averages and 2 standard deviations, which is a statistical measure of volatility. Click here to download the Bollinger Bands Indicator
RSI Indicator Settings
The preferred settings for the RSI indicator are the default settings. We’re going to use a 14-period setting in order to evaluate the quality of the overbought and oversold conditions. Click here to download the RSI Indicator

The 4 Hour RSI Bollinger Bands Forex Trading Strategy Buy/Sell Rules
There are many ways to use the Bollinger Bands but one of the most common and the most popular is to search for these periods of particularly low volatility which in technical terms it’s called the Bollinger squeeze. A squeeze happens when the Bollinger Bands are particularly narrow, which can also be referred to as the calm before the storm. This is a period in time when the volatility is particularly low is followed soon after by a period of high volatility.
The Bollinger Bands themselves won’t tell you precisely which way the market is going to break out and that’s the reason why we use other tools such as the RSI indicator which will tell us whether the market is in oversold condition and the higher probabilities are for an upside breakout or whether we’re in overbought conditions and the higher probabilities are for a downside breakout.
The Buy/Sell trading rules of the 4h RSI – Bollinger Bands Forex trading strategy:
- Buy signal: Wait for the Bollinger Bands to turn flat and see the “squeeze” effect. When the RSI breaks below the 30 line into oversold conditions, wait for a retest of lower BB and wait for the current 4h candle close before buying at the market. Place your protective stop loss below the current range and below the lower band. Take profit once the RSI breaks above the 70 line into overbought conditions.
- Sell Signal: Wait for the Bollinger Bands to turn flat and see the “squeeze” effect. When the RSI break above the 70 line into overbought conditions, wait for a retest of the upper BB and wait for the current 4h candle close before selling at the market. Place your protective stop loss above the current range and above the upper Bollinger Band. Take profit once the RSI breaks below the 30 line into oversold conditions.
Buy/Sell Trade Examples
In Figure 3 we have the 4 hour EUR/USD chart and a short trading opportunity is highlighted. We can note that as soon as the Bollinger Bands squeeze and turn flat at the same time the price action started to move in a tight range. The premise behind the 4h RSI-Bollinger Bands strategy is that after tight ranges always follows big expansion ranges and with the help of the Bollinger Bands and the RSI indicator we can catch these explosive price moves.

In Figure 4 we have the 4h GBP/USD chart and a long trade example is presented. The 4h RSI – Bollinger Bands strategy is a universal strategy that can be applied to any currency pair. The strength and the power of this strategy is that once a trend has developed it will try to keep you in the trade for as long as possible. In Figure 4 we can see that the take profit order was only triggered at the end of the trend which resulted in winning a staggering +1150 pips and what is more important it only required a very tight stop loss.

In our last example, we’re going to highlight the fact that the 4h RSI – Bollinger Bands strategy performs great not only as a trend following strategy, but it can be used to spot reversal in the trend as well. However, the greatest thing about the 4h RSI – Bollinger Bands Forex trading strategy is the fact that all trading opportunities provide you with a very attractive risk to reward ratio.

Claim Your $60 No Deposit Bonus Here
All you need is to have your live account verified!
Of course, you need to open a live account...
2 Brokers that we like A LOT!
USD30 from each Forex Broker Below.
Both Forex Brokers have excellent rating!
We use both of these brokers and proudly promote them!
NOTE: Not all countries qualify for these bonuses. Terms and Condition Applies.Other Analysis Today