
USD/JPY Daily Price Forecast – 28th March 2025

If you like our trade signals, join us on our PREMIUM TELEGRAM CHANNEL.
117% ROI in ONLY 10 days. Join our Facebook Group to learn more.

Trade Summary:
USDJPY
Buy Stop @ 150.931
TP @ 151.27
SL @ 150.437
USD/JPY Analysis (H4 Chart)
Overview
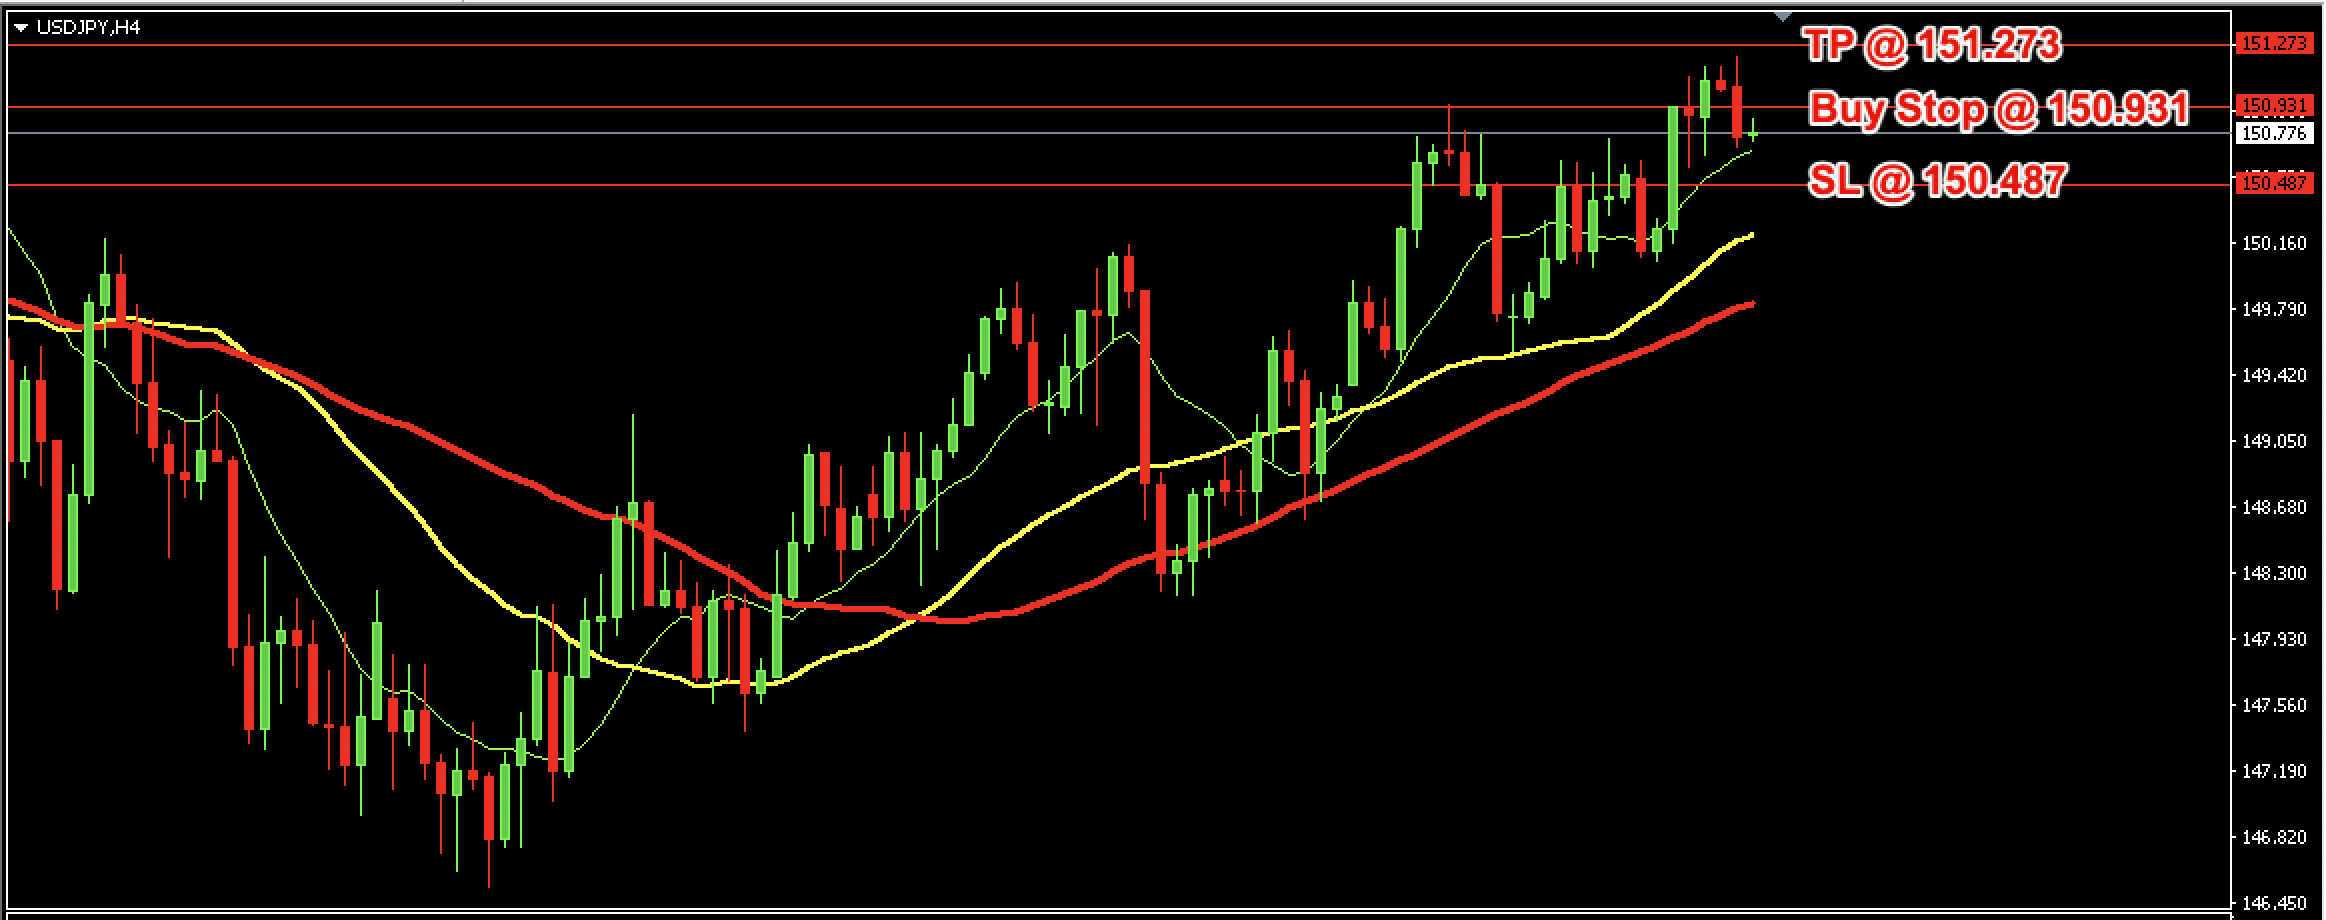
The chart provided is a 4-hour (H4) timeframe for the USD/JPY currency pair. The analysis highlights a Buy Stop order at 150.931, a Stop Loss (SL) at 150.487, and a Take Profit (TP) at 151.273. The chart also includes moving averages (red, yellow, and green lines) and candlestick patterns, which provide insights into the market’s trend and momentum.
Key Observations
Trend Analysis
The price is in an uptrend, as indicated by the series of higher highs and higher lows.
The moving averages (MA) are aligned in a bullish configuration:
The green line (short-term MA) is above the yellow line (medium-term MA), which is above the red line (long-term MA).
This alignment confirms strong bullish momentum.
Buy Stop Placement
The Buy Stop is placed at 150.931, slightly above the current price level. This suggests that the trader is waiting for confirmation of bullish momentum before entering the trade.
Stop Loss (SL)
The Stop Loss is set at 150.487, below the recent support level. This placement minimizes risk by exiting the trade if the price reverses and invalidates the bullish setup.
Take Profit (TP)
The Take Profit is set at 151.273, which is near a resistance level. This level is likely based on previous price action or a calculated risk-reward ratio.
Candlestick Patterns
Recent candlesticks show bullish momentum, with green candles dominating the chart.
There is no significant bearish reversal pattern visible, supporting the bullish bias.
Support and Resistance Levels
Support: The area around 150.487 acts as a key support level, as it aligns with the Stop Loss.
Resistance: The 151.273 level is a key resistance zone, where the price may face selling pressure.
Technical Indicators
Moving Averages
The moving averages are sloping upwards, confirming the bullish trend.
The price is trading above all the moving averages, which is a strong bullish signal.
Momentum
The upward momentum is strong, as the price continues to make higher highs and higher lows.
Trade Setup Analysis
Entry: The Buy Stop at 150.931 ensures that the trade is only triggered if the bullish momentum continues.
Risk Management: The Stop Loss at 150.487 provides a reasonable buffer below the support level, limiting downside risk.
Reward: The Take Profit at 151.273 offers a favorable risk-reward ratio, targeting a key resistance level.
Potential Scenarios
Bullish Continuation
If the price breaks above 150.931, it is likely to reach the 151.273 target, as the bullish trend remains intact.
Reversal
If the price fails to break above 150.931 and falls below 150.487, it could signal a trend reversal or deeper pullback.
Conclusion
The USD/JPY pair is in a strong uptrend, and the trade setup aligns with the bullish momentum. The Buy Stop, Stop Loss, and Take Profit levels are strategically placed to capitalize on the trend while managing risk effectively. Traders should monitor the price action around the 150.931 level for confirmation of the breakout.
Recommended Lot Size
Trading is all about statistics.
While we can experience winning streaks, we can also suffer from losing streaks.
As such, we should always size each trade to withstand losing streaks (if any).
It’s widely recommended that you should not risk more than 2% of your capital for each trade.
We believe it’s easier to control your lot size by limiting your lot sizing to 0.01 for every $500 in your account.
So if you have $5000, then risk no more than 0.10 lot size per trade.
*****************
If you spot a mistake especially when it comes to the price, please use common sense and check the chart.
We wish you good luck and good profit for this trade idea.
For more trade ideas, join the Price Action Society…
Start with a $30 trading bonus
Trade forex and CFDs on stock indices, commodities, stocks, metals, and energies with these licensed and regulated brokers.
For all clients who open their first real account, these brokers offer a $30 trading bonus to test their products and services without any initial deposit needed.
Learn more about how you can trade over 1000 instruments on their MT4 and MT5 platforms from your PC and Mac, or from a variety of mobile devices.


If you like our analysis and would like to receive 3 to 7 trade ideas per day, then
Click here to learn more about the Price Action Society.
Claim Your $60 No Deposit Bonus Here
All you need is to have your live account verified!
Of course, you need to open a live account...
2 Brokers that we like A LOT!
USD30 from each Forex Broker Below.
Both Forex Brokers have excellent rating!
We use both of these brokers and proudly promote them!
NOTE: Not all countries qualify for these bonuses. Terms and Condition Applies.Other Analysis Today