
The Awesome Oscillator, designed by Bill Williams is used to measure the market momentum.

Trading as a histogram, the Awesome oscillator measures the difference between the 34 period and a 5 period simple moving averages.
The main difference with the way the simple moving averages are calculated is that the midpoint or the OHLC/4 is used rather than the closing prices.
There are no present inputs that can be used for the Awesome oscillator. For a beginner, the Awesome Oscillator is a great way to get started with trading with indicators.
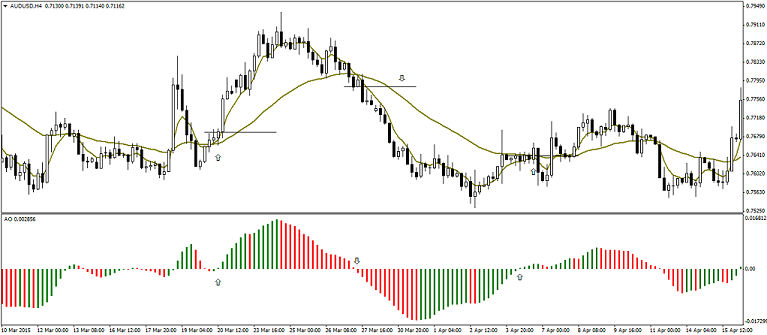
The chart below shows the Awesome oscillator applied to the charts. Also, the 34 and 5 period SMA’s based on the weighted close or the midpoint of prices are used to illustrate how the convergence and divergence in the SMA’s are reflected by the Awesome oscillator.
Awesome Oscillator Explained Video
In a way, the Awesome Oscillator is similar to the MACD which uses as 12, 26 period moving average or even the OSMA also known as the moving average oscillator.
What is the Awesome Oscillator?
The Awesome Oscillator is a technical indicator used to measure market momentum.
It is a simple and efficient tool that can be used by traders of all levels of experience. I
n this article, we will explain what the Awesome Oscillator is, how it works, and how you can use it to improve your trading.
We will also provide a free downloadable indicator for you to use in your own trading.
The Awesome Oscillator is a momentum indicator used to measure market momentum.
The Awesome Oscillator is calculated using the difference between the 34-period and 5-period Simple Moving Averages.
The Awesome Oscillator can be used to identify trend reversals, as well as to confirm trends.
When the Awesome Oscillator is above 0, it indicates that the market is in an uptrend.
When the Awesome Oscillator is below 0, it indicates that the market is in a downtrend.
The Awesome Oscillator can also be used to generate buy and sell signals.
A buy signal is generated when the Awesome Oscillator crosses above 0 from below.
A sell signal is generated when the Awesome Oscillator crosses below 0 from above.
How to trade with the Awesome oscillator?
The Awesome Oscillator is a technical indicator used to measure market momentum.
It is calculated using a formula that takes into account the difference between the 34-period and 5-period simple moving averages.
The Awesome Oscillator can be used to trade a variety of market conditions, but is most commonly used to trade trends.
When the Awesome Oscillator is above zero, it indicates that the short-term moving average is above the long-term moving average, which suggests that the market is in an uptrend.
Conversely, when the Awesome Oscillator is below zero, it indicates that the short-term moving average is below the long-term moving average, suggesting that the market is in a downtrend.
Trend trading with the Awesome Oscillator can be done by looking for periods where the indicator is above or below zero and then entering into a trade in the direction of the trend.
For instance, if the Awesome Oscillator is above zero and rising, traders might buy into an uptrend expecting prices to continue to move higher.
Alternatively, if the Awesome Oscillator is below zero and falling, traders might sell into a downtrend expecting prices to continue to move lower.
The Awesome Oscillator is a technical indicator used to measure market momentum.
The oscillator is calculated using the difference between a 5-period and 34-period simple moving average (SMA).
A buy signal is generated when the 5-period SMA crosses above the 34-period SMA. A sell signal is generated when the 5-period SMA crosses below the 34-period SMA.
The Awesome Oscillator can be used to identify market turning points, as well as trend strength.
When the indicator is above zero, it indicates that the short-term SMA is above the long-term SMA, suggesting bullish momentum.
Conversely, when the indicator is below zero, it suggests bearish momentum.
Awesome Oscillator signals are most reliable when they occur in confluence with other technical indicators.
For example, a buy signal may be more reliable if it occurs after a period of price consolidation or after an oversold condition has been reached on a Relative Strength Index (RSI) chart.
The Awesome oscillator comes with a predetermined set of buy/sell signal rules.
0-line Crossing: Long signals are generated when the AO crosses above the 0-line and then exited when the AO moves back below the 0-line, where short positions are initiated.
In a way, trading the 0-line crossing of the AO is just the same as trading the moving average cross over.
When markets are trending strongly, the AO no doubt triggers strong signals, but the oscillator’s performance drops when prices are trading sideways.
The chart below shows a few sample buy sell signals based on the AO’s 0-line interaction.
Notice some instances where a few trades would have resulted in a losing trade as prices start to move sideways coming off a strong previous trend.
Therefore, when using the AO as the 0-line buy/sell indicator, it is always best to use the signals in combination with other indicators to avoid the false signals.
Divergence: The AO can also be used to spot price divergences such as failure to confirm new highs or lows in the markets. The next chart below shows a few divergence set up examples where the lows were not confirmed by the AO.
 Awesome Oscillator – Divergence Setup
Twin Peaks Method: Another widely used method to trade with the Awesome oscillator is the twin peaks method.
In this system, long signals are taken when the AO is above the 0-line. The AO declines but then posts two consecutive Green higher bars.
Long positions are taken on the candle close which signals a continuation of the uptrend. Likewise, when the AO is below the 0-line and it posts green bars and starts to pull back by printing lower low strong Red bars, it signals a short position that can be taken.
The Twin cups method is illustrated in the next chart.

Awesome Oscillator – Twin Peaks method
The Awesome oscillator as illustrated above is a simple trading indicator which can be used in a different ways, both as a standalone indicator and also in conjunction with other indicators such as moving averages, Bollinger bands or the Accelerator Oscillator.
Advantages of Using the Awesome Oscillator
There are several reasons why the Awesome Oscillator is a powerful technical indicator.
First, it is very accurate in identifying short-term momentum changes.
Second, it is relatively easy to interpret, which makes it a good choice for new traders.
Finally, it can be used in conjunction with other technical indicators to provide even more insights into the market.
1. The Awesome Oscillator can help you identify trends.
2. The Awesome Oscillator can help you make better trading decisions.
3. The Awesome Oscillator is free to download and use.
4. The Awesome Oscillator is easy to use and understand.
5. The Awesome Oscillator can be used in any market, on any time frame.
Disadvantages of Using the Awesome Oscillator
There are a few disadvantages of using the Awesome Oscillator.
First, it is a lagging indicator, meaning it doesn’t give signals until after the price has moved.
Second, because it’s based on past prices, it isn’t necessarily predictive of future price movements.
Finally, the Awesome Oscillator can give false signals in choppy markets.
Awesome Oscillator Explained Conclusion
The Awesome Oscillator is a versatile technical indicator that can be used to measure market momentum, identify trend reversals, and generate trade signals.
While the Awesome Oscillator is not without its limitations, it is a valuable tool that every trader should have in their arsenal.
With proper use, the Awesome Oscillator can help you achieve success in the financial markets.
Awesome Oscillator Indicator Top 5 FAQ
How to Read an Awesome Oscillator Indicator?
The AO is a histogram that gives traders visualized information about the momentum of recent price action at any given time. The AO’s centerline is used as a signal line to help traders make buy and sell decisions.
What Does an Awesome Oscillator Tell You?
An awesome oscillator can help you gauge the momentum of recent price action, and also indicate whether or not recent price action is overbought or oversold.
How do I use an Awesome Oscillator Indicator?
There are many ways to use an AO, but one popular method is to look for divergences between the AO and price action. A bullish divergence occurs when the AO makes a higher low while price action makes a lower low. This can be used as a potential buy signal. Likewise, a bearish divergence occurs when the AO makes a lower high while price action makes a higher high. This can be used as a potential sell signal.
What is the difference between MACD and Awesome Oscillator?
MACD stands for moving average convergence divergence. Like the AO, the MACD is a momentum indicator. The main difference between the two indicators is that the MACD uses exponential moving averages, while the AO uses simple moving averages.
How do you trade awesome oscillator?
There are many ways to trade with the AO, but one popular method is to look for divergences between the AO and price action. A bullish divergence occurs when the AO makes a higher low while price action makes a lower low. This can be used as a potential buy signal. Likewise, a bearish divergence occurs when the AO makes a lower high while price action makes a higher high. This can be used as a potential sell signal.
Claim Your $60 No Deposit Bonus Here
All you need is to have your live account verified!
Of course, you need to open a live account...
2 Brokers that we like A LOT!
USD30 from each Forex Broker Below.
Both Forex Brokers have excellent rating!
We use both of these brokers and proudly promote them!
NOTE: Not all countries qualify for these bonuses. Terms and Condition Applies.Other Analysis Today