
The trading strategy using Bollinger Bands and Moving average might seem as a redundant trading set up, considering that Bollinger Bands and Moving average both tend to aptly reflect the trends in the market. However, with a few tweaks, a simple trading strategy can be developed where in, the Bollinger Bands can be used purely as a volatility indicator while the moving averages are used as signal indicator to buy or sell. One might argue as to what edge traders might gain considering that buy and sell signals are generated based on bullish and bearish moving averages cross over. In this strategy we explore a rather unique trading set up which helps traders to eliminate false trading signals one might get if using only the moving averages in isolation.

Bollinger Bands and Moving Average Strategy Chart Set up
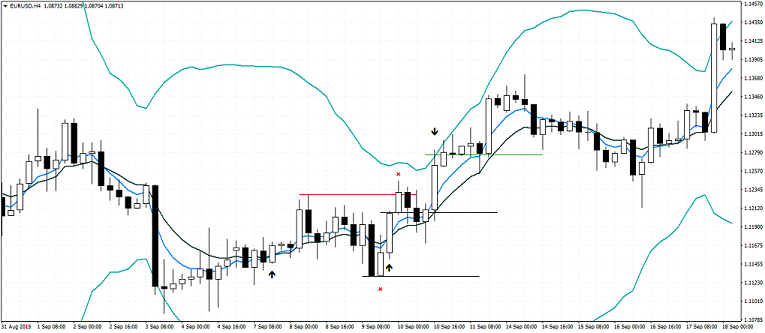
The Bollinger Bands for this trading strategy is tweaked to 30 periods for the Bands and 3 Standard deviations. The moving averages are set up to 5 and 10 period exponential moving average. For this trading strategy, we do not need the mid Bollinger band, which can be set to ‘invisible’. Once the indicators are added, your charts look the picture shown below.

Bollinger Bands and Moving Average – Trading Rules
Buy Signal:
- Moving averages must be currently bearish (5 EMA must be below 10 EMA)
- When the moving averages signal a bullish crossover, i.e.: 5 EMA crosses above 10 EMA, check if previous sell signal saw prices touching the lower Bollinger Band.
- If no, then go long at market and set stops to the recent low (if yes, do not trade the EMA crossover)
- Exit the long position when price touches the upper Bollinger Band
Sell Signal:
- Moving averages must be currently bullish (5 EMA must be above 10 EMA)
- When the moving averages signal a bearish crossover, i.e.: 5EMA crosses below 10 EMA, check if previous buy signal saw prices touching the upper Bollinger Band.
- If no, then go short at market and set stops to the previous high (if yes, do not trade the EMA crossover)
- Exit the short position when price touches the lower Bollinger Band
Bollinger Bands and Moving Averages – Buy/Sell Trade Examples
Buy Signal Example
 Bollinger Bands and Moving Average – Buy Signal Example
- Moving averages give a sell signal with the 5 EMA crossing below 10 EMA
- The sell signal did not see prices touch down to the lower Bollinger Band, so we look for long positions
- 5 EMA crosses above 10 EMA, and we go long when the candle closes and enter at market
- Stops are set to the previous low marked by the Red line
- The long position is closed when price touches the Upper Bollinger Band.
Sell Signal Example

Bollinger Bands and Moving Average – Sell Signal Example
- 5 EMA crosses above the 10 EMA but prices fail to touch the upper Bollinger Band, so we look for a bearish crossover to trade the short side
- 5 EMA crosses below the 10 EMA and a short position is taken when the signal is confirmed. Stops are set to the previous high
- The short trade is closed when prices touch the lower Bollinger Band
The next chart shows a failed set up, but one which quickly signaled an opposite trade.
Bollinger Bands and Moving Average – Failed Trade Example
- The EMA’s give a bullish signal but prices fail to reach the outer Bollinger Band, so we wait for a bearish EMA crossover to trade the short side.
- Few sessions later, the EMA’s give a bearish signal and we enter short with stops at the recent high. However, prices quickly turn back higher and hit the stops. With the failed short set up, we now look for long positions and in the next two sessions, the EMA’s signal a bullish crossover. A long position here would have seen the trade being closed out for a profit at the upper Bollinger Band.
Bollinger Bands and Moving Average Strategy – Final Note…
As illustrated above, the Bollinger Bands and moving averages is a rather simple trading strategy which aims to filter out false moving average signals. The Bollinger Band’s upper and lower median lines help in exiting the trades. This set up makes it easy even for beginners to trade with and works in any market on time frames of H1 and above, although the 4-hour chart set ups work the best.
Claim Your $60 No Deposit Bonus Here
All you need is to have your live account verified!
Of course, you need to open a live account...
2 Brokers that we like A LOT!
USD30 from each Forex Broker Below.
Both Forex Brokers have excellent rating!
We use both of these brokers and proudly promote them!
NOTE: Not all countries qualify for these bonuses. Terms and Condition Applies.Other Analysis Today