
EUR/USD Daily Price Forecast – 21st August 2025

If you like our trade signals, join us on our PREMIUM TELEGRAM CHANNEL.
117% ROI in ONLY 10 days. Join our Facebook Group to learn more.

Trade Summary:
EURUSD
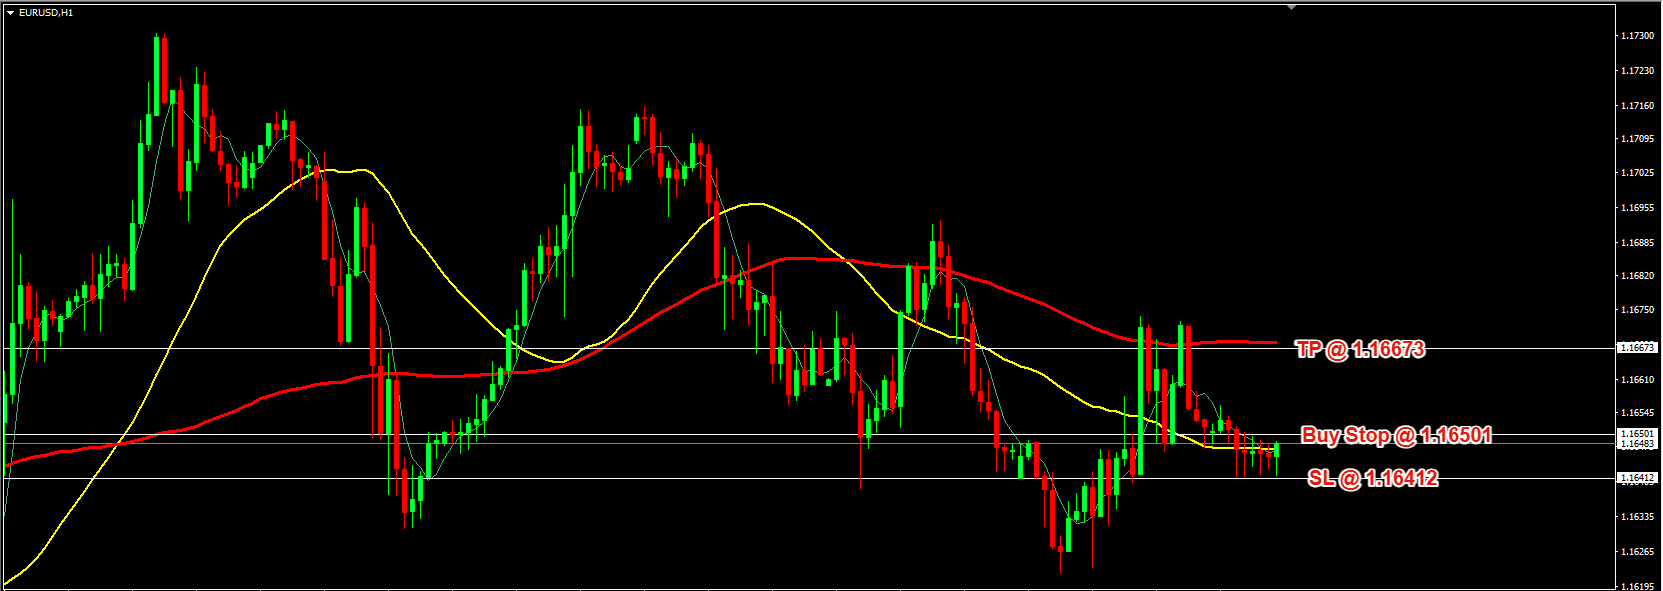
Buy Stop @ 1.16501
TP @ 1.16673
SL @ 1.16412
________________________
Trade Setup Analysis: EUR/USD H1 – Catching a Potential Bullish Breakout
In this post, I’m sharing a detailed breakdown and justification for my recent EUR/USD trade setup on the 1-hour chart. Let’s dig into the technicals, structure, and reasoning behind this strategic entry.
Chart Context & Setup
Instrument: EUR/USD
Timeframe: 1 Hour (H1)
Trade Type: Buy Stop Order
Buy Stop: 1.16501
Take Profit (TP): 1.16673
Stop Loss (SL): 1.16412
1. Technical Structure
A. Key Levels & Price Action
The EUR/USD has been consolidating after a pronounced drop, with price action forming a tight horizontal range between 1.1641 and 1.1650. Multiple candlestick wicks indicate that selling pressure is stalling near 1.1641, marking it as a significant intraday support.
Meanwhile, the 1.1650 zone is acting as a resistance ceiling, with price unable to close decisively above it in recent hours. This sets the stage for a potential breakout scenario.
B. Moving Averages & Momentum
Yellow Line: 50-period Moving Average (MA)
Red Line: 200-period MA
The 50 MA is below the 200 MA, confirming the recent downtrend. However, both MAs are now relatively flat, signaling a loss of bearish momentum and the likelihood of an imminent directional move (compression often precedes expansion).
Moreover, price is consolidating just beneath the 50 MA, suggesting that a push above resistance could see bulls retake short-term control, especially if momentum builds above the moving average cluster.
2. Trade Rationale
A. Why a Buy Stop at 1.16501?
By placing the buy stop just above resistance and consolidation, the trade seeks confirmation of bullish intent – it only triggers if price breaks out of the range, thus minimizing exposure to “false breaks” or continued choppy sideways action.
B. Stop Loss Logic (1.16412)
The stop is strategically placed beneath repeated rejection wicks and underneath the established support. A break below this level would invalidate the immediate bullish thesis, as it would likely open further downside risk.
C. Take Profit Placement (1.16673)
The TP is set just before the next major resistance, a level where recent rallies have stalled and selling pressure could re-emerge. This captures optimal risk/reward without being greedy, closing the trade in a liquidity pocket.
3. Risk-Reward & Trade Management
Risk: 0.00089 (8.9 pips)
Reward: 0.00172 (17.2 pips)
Risk/Reward Ratio: ≈ 1:2 (Excellent — aligns with sound trading principles)
This means profits are targeted at roughly twice the risk, providing a cushion against whipsaws and making it easier to stay profitable over the long run, even with a win rate below 50%.
4. Conclusion: Why Does This Trade Make Sense?
Breakout Strategy: The setup waits for price to prove itself by breaking resistance, rather than catching a falling knife or fading momentum.
Strong Structure: Well-defined support and resistance, clear candle wicks for validation, and consolidation after a trend — ideal ingredients for a breakout play.
Sound Risk Management: Tight stop loss under structure, ambitious but realistic profit-taking.
Trend Reversal Potential: If the range breaks upwards, it could mark the start of a larger correction/short-term trend reversal, especially with moving averages compressing.
Bottom Line:
This EUR/USD H1 trade is a classic breakout strategy rooted in price action principles, disciplined risk management, and confirmation-based entry. By letting the market “show its hand” first, the setup avoids low-probability trades and aims for quality, not quantity.
Always remember: No setup is foolproof. Adhere to your risk parameters and stay adaptable as market conditions shift!
Recommended Lot Size
Trading is all about statistics.
While we can experience winning streaks, we can also suffer from losing streaks.
As such, we should always size each trade to withstand losing streaks (if any).
It’s widely recommended that you should not risk more than 2% of your capital for each trade.
We believe it’s easier to control your lot size by limiting your lot sizing to 0.01 for every $500 in your account.
So if you have $5000, then risk no more than 0.10 lot size per trade.
*****************
If you spot a mistake especially when it comes to the price, please use common sense and check the chart.
We wish you good luck and good profit for this trade idea.
For more trade ideas, join the Price Action Society…
Start with a $30 trading bonus
Trade forex and CFDs on stock indices, commodities, stocks, metals, and energies with these licensed and regulated brokers.
For all clients who open their first real account, these brokers offer a $30 trading bonus to test their products and services without any initial deposit needed.
Learn more about how you can trade over 1000 instruments on their MT4 and MT5 platforms from your PC and Mac, or from a variety of mobile devices.


If you like our analysis and would like to receive 3 to 7 trade ideas per day, then
Click here to learn more about the Price Action Society.
Claim Your $60 No Deposit Bonus Here
All you need is to have your live account verified!
Of course, you need to open a live account...
2 Brokers that we like A LOT!
USD30 from each Forex Broker Below.
Both Forex Brokers have excellent rating!
We use both of these brokers and proudly promote them!
NOTE: Not all countries qualify for these bonuses. Terms and Condition Applies.Other Analysis Today