
GBP/USD Daily Price Forecast – 8th September 2025

If you like our trade signals, join us on our PREMIUM TELEGRAM CHANNEL.
117% ROI in ONLY 10 days. Join our Facebook Group to learn more.

Trade Summary:
GBPUSD
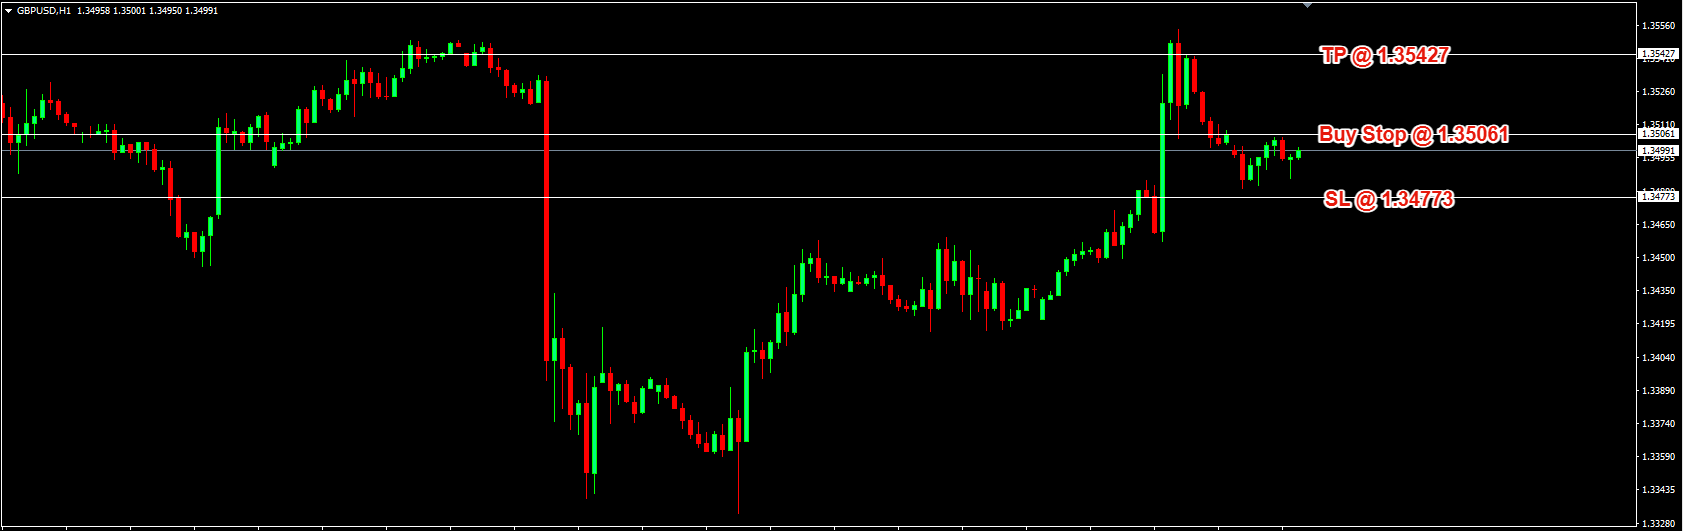
Buy Stop @ 1.35061
TP @ 1.35427
SL @ 1.34773
________________________
GBPUSD Technical Analysis — Structure, Levels, and Trade Scenarios
Market structure
Trend context: After a sharp selloff, price carved a base and began printing higher lows, then impulsively expanded to the upside. The current phase shows a pullback and compression under nearby resistance—typical of a potential breakout–continuation setup if buyers maintain control.
Swing map: The recent impulse high sits near 1.3550–1.3555. Pullback lows are clustering above 1.3470–1.3480, preserving a short-term bullish structure.
Key levels from the chart
Buy stop: 1.35061 — placed marginally above local resistance to require confirmation.
Stop loss: 1.34773 — below the most recent higher-low cluster and intra-day demand.
Take profit: 1.35427 — inside the prior reaction zone/supply just below 1.3550.
Intermediate zones:
Support: 1.3475–1.3485 (pullback demand and invalidation zone)
Mid-range resistance: 1.3500–1.3510 (breakout trigger band)
Overhead supply: 1.3535–1.3555 (TP area and prior spike high)
Price action read
Impulse and retrace: The strong bullish spike followed by controlled pullback suggests buyers remain interested, but supply is active near 1.3535–1.3555.
Consolidation: Recent candles show narrowing range, indicating energy build-up. Breaks from such compression often travel to the next liquidity pocket.
Liquidity cues:
Buy-side liquidity likely rests above 1.3510–1.3520 (recent lower highs inside the pullback) and above 1.3550 (spike high).
Sell-side liquidity likely rests below 1.3480 and 1.3465; a sweep there could fuel a deeper retrace.
Scenario planning
Bullish continuation (primary)
Trigger: A decisive push through 1.3506 with follow-through (full-bodied H1 close or a break-and-hold on retest).
Path: Break 1.3506 → fill pocket into 1.3520–1.3530 → test supply at 1.3535–1.3550.
Targets:
TP1: 1.3520–1.3525 (take partials to pay risk if momentum is average)
TP2: 1.3542 (chart-defined TP)
Stretch: 1.3560–1.3570 if 1.3555 breaks cleanly on volume and closes.
Management ideas:
Consider moving to breakeven only after a higher low forms above 1.3506 or after an H1 close above 1.3520.
If the breakout prints a long upper wick and immediate rejection, avoid chasing; wait for a clean retest of 1.3506–1.3510.
Bearish fade / deeper pullback (alternative)
Trigger: Failure to hold above 1.3500 with a heavy rejection candle, or an H1 close below 1.3477.
Path: Loss of 1.3477 opens room to probe 1.3460–1.3450; if that folds, 1.3420–1.3430 is next structural interest.
Bearish signs:
Consecutive H1 closes below 1.3480.
Lower highs forming beneath 1.3500 with expanding bearish candle bodies.
Invalidation and risk
Structural invalidation for the long idea sits beneath 1.3477. An H1 close below this level weakens the bullish thesis and favors standing aside or reassessing from lower demand.
The current plan’s risk-to-reward is roughly 1:1.27 (about 28.8 pips risk for 36.6 pips target). It’s a modest but repeatable edge when executed consistently.
Quality-of-break checklist
Body over wick: Prefer a breakout with a solid close above 1.3506 rather than a wick-only tag.
Retest behavior: A controlled pullback that holds 1.3506–1.3510 after breakout strengthens confidence.
Session timing: Breakouts during London open/overlap tend to carry better follow-through than late-session drifts.
What would strengthen the long case
A higher low on M15/H1 printed above 1.3490–1.3495 before or after the break.
Momentum sequence: expansion candle → brief consolidation → continuation candle through 1.3520.
What would weaken it
Multiple upper-wick rejections inside 1.3520–1.3530 with rising bearish momentum.
A liquidity sweep above 1.3506 that immediately closes back inside the range on H1.
Summary
Bias: Constructive above 1.3477 with a breakout-continuation setup through 1.3506 targeting 1.3520–1.3542, and potentially 1.3560 on extension.
Invalidated on sustained H1 trade below 1.3477, opening room for a deeper pullback into 1.3460–1.3450 and possibly 1.3420–1.3430.
Recommended Lot Size
Trading is all about statistics.
While we can experience winning streaks, we can also suffer from losing streaks.
As such, we should always size each trade to withstand losing streaks (if any).
It’s widely recommended that you should not risk more than 2% of your capital for each trade.
We believe it’s easier to control your lot size by limiting your lot sizing to 0.01 for every $500 in your account.
So if you have $5000, then risk no more than 0.10 lot size per trade.
*****************
If you spot a mistake especially when it comes to the price, please use common sense and check the chart.
We wish you good luck and good profit for this trade idea.
For more trade ideas, join the Price Action Society…
Start with a $30 trading bonus
Trade forex and CFDs on stock indices, commodities, stocks, metals, and energies with these licensed and regulated brokers.
For all clients who open their first real account, these brokers offer a $30 trading bonus to test their products and services without any initial deposit needed.
Learn more about how you can trade over 1000 instruments on their MT4 and MT5 platforms from your PC and Mac, or from a variety of mobile devices.


If you like our analysis and would like to receive 3 to 7 trade ideas per day, then
Click here to learn more about the Price Action Society.
Claim Your $60 No Deposit Bonus Here
All you need is to have your live account verified!
Of course, you need to open a live account...
2 Brokers that we like A LOT!
USD30 from each Forex Broker Below.
Both Forex Brokers have excellent rating!
We use both of these brokers and proudly promote them!
NOTE: Not all countries qualify for these bonuses. Terms and Condition Applies.Other Analysis Today