
In this strategy post, we have a Simple Forex Trading Strategy that combines the reliability of the Fibonacci Retracement Levels with the popular momentum indicator, MACD. Fibonacci retracement levels are one of the more commonly used price levels to measure retracements in a trend. The general rules governing Fibonacci retracements is that prices tend to reverse either near the 38.2% or 61.8% of the previous trend. Some traders consider the Fibonacci levels to be magical or mysterious in nature, but more often than not, Fibonacci retracements are a self fulfilling prophecy. Meaning that, with a wide number of traders watching the retracement levels, the reversals near either of the Fibonacci levels are self fulfilling.

There are many different approaches to trading with the Fibonacci retracement levels. Although 61.8% of 0.618 represents the Golden Mean traders also use variations such as 38.20% or 0.382, 50%, 23.6%. For the purpose of this article and the trading strategy, we will only consider the 61.80% as the true Fibonacci level. The MACD, Moving Average Convergence Divergence is one of the most popular trading oscillator used to determine trends. As the name suggests, the MACD comprises of the histogram, the MACD line and the signal line. The most common setting for the MACD is 12, 26 and 9.
[sociallocker id=”9428″] The Profit Booster Report Download Link [/sociallocker]
Combining the power of MACD and the Fibonacci retracement tool, traders could look at potential trading opportunities that come by. In this trading strategy, the most basic concept is:
- Buy the retracement in an uptrend
- Sell the retracement in a downtrend
The retracement levels are used by the Fibonacci tool while the MACD is used as a trigger for the signal.
Fibonacci Retracement and MACD Chart Set Up
You can use any time frame for this strategy, but is best to stick to H1 or H4 charts. Alternately, you can look at smaller time frames provided there is a strong trend that is formed. The first step is to add the MACD indicator. The default MT4 MACD indicator is not the right indicator to be used. Therefore use the one attached to this article.
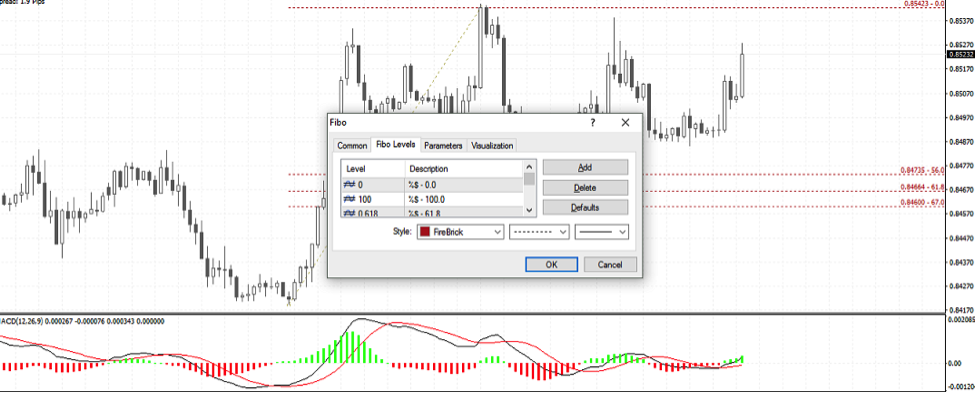
After the MACD is added, the next step is to use the MT4’s Fibonacci tool and remove all other Fib levels. Simply retain 0, 100 and 61.8 levels. You can also add to levels, at 56% and 67% to allow for some room for prices to retrace. To customize the Fibonacci tool, first add the tool on the chart. Now, right-click and select ‘Fibo Properties’. Switch to the Fibo Levels tab and enter the levels as follows:
| Level | Description |
| 0 | %$ – 0.00 |
| 100 | %$ – 100.0 |
| 0.618 | %$ – 61.8 |
| 0.67 | %$ – 67.0 |
| 0.56 | %$ – 56.0 |
The chart below shows how to modify the Fibonacci settings.
Simple Forex Trading Strategy with Fibonacci Retracement and MACD Trading Rules
Long Trading Rules:
- Identify a strong uptrend on the time frame of your choice
- Wait for price to print lower local highs
- Using the Fibonacci tool connect the lowest point to the highest point
- Wait for price to fall to the retracement zone between 56% – 67%
- Wait for MACD to trigger a buy signal
- Long on the candle close after the signal triggers
- Set first target to the previous high with stops a few pips below the recent low before the retracement

The chart above shows a perfect set up. First, using the Fibonacci tool, we measure the recent upswing. Then, we wait for price to hover near the 61.8% fib level and wait for MACD to trigger a buy. A long position was taken after the MACD and Signal line crossed over with the MACD histogram rising above the 0-line. Stops are place a few pips below the recent swing low. The target is set to the recent peak, which is reached.
Short Trading Rules:
- Identify a strong downtrend on the time frame of your choice
- Wait for price to print higher local lows
- Using the Fibonacci tool connect the highest point to the lowest point
- Wait for price to fall to the retracement zone between 56% – 67%
- Wait for MACD to trigger a sell signal
- Short on the candle close after the signal triggers
- Set first target to the previous low with stops a few pips above the recent high before the retracement

In the above example, after prices posted a strong decline, we used the Fibonacci tool to spot the potential retracement levels. Soon enough, prices rallied to the 61.8% price zone. Here, after the MACD signal gave a bearish signal, we go short on the trade, targeting the recent low with stops placed at the recent high which in this case is the high of the retracement.
The Advantages and Disadvantages of this Simple Forex Trading Strategy with Fibonacci Retracement Levels and MACD as Confirmation
Advantages
- Works on any time frame and any market, although stick to majors and H1 time frame or higher to avoid wider spreads
- Easy to work with
- The strategy works on a ‘Follow the trend’ which is safer to trade
- MACD helps in confirming the retracement or the reversal
- An open/flexible trading system which can be expanded upon (ex: you can set TP2 to 1.618% Fibonacci extension or any other level of your choice)
Disadvantages
- You will have to closely watch the charts especially when a retracement begins
- The closer price gets to the ‘Reversal’ zone the more alert you need to be. Depending on the time of the day, price moves to the reversal, you might have some missed opportunities
- Price spikes are common (even more common in lower time frame charts) and could potentially hit the stop loss (also known as stop hunting) so the stop loss levels need to be carefully chosen
[sociallocker id=”9428″] The Profit Booster Report Download Link [/sociallocker]
We recommend using the 4H chart as this will have less price volatility as compared to lower time frames. Retracement levels are also stronger and you get less false signals. Like all strategies, it’s wise to practise this on your demo account first before trying this out on your real money account.
Claim Your $60 No Deposit Bonus Here
All you need is to have your live account verified!
Of course, you need to open a live account...
2 Brokers that we like A LOT!
USD30 from each Forex Broker Below.
Both Forex Brokers have excellent rating!
We use both of these brokers and proudly promote them!
NOTE: Not all countries qualify for these bonuses. Terms and Condition Applies.Other Analysis Today