
As you might already know, understanding trends is crucial to your long term success as a trader. As a trader, you can use the Trend Strength MT4 Indicator to pin point your entries and even exits. On its own, the Trend Strength MT4 Indicator provides you a good indication of the market strength but it should not be used alone. To increase the accuracy, you can combine it with other indicators that you might be familiar with like the Moving Averages or Bollinger Bands.

[sociallocker id=”6709″]Trend Strength MT4 Indicator Download Link [/sociallocker]
Trend Strength MT4 Indicator – Chart Setup
Chances are you will like this indicator for its simplicity. After installing the Trend Strength Indicator onto your MT4 Platform, you should have a similar chart as below.

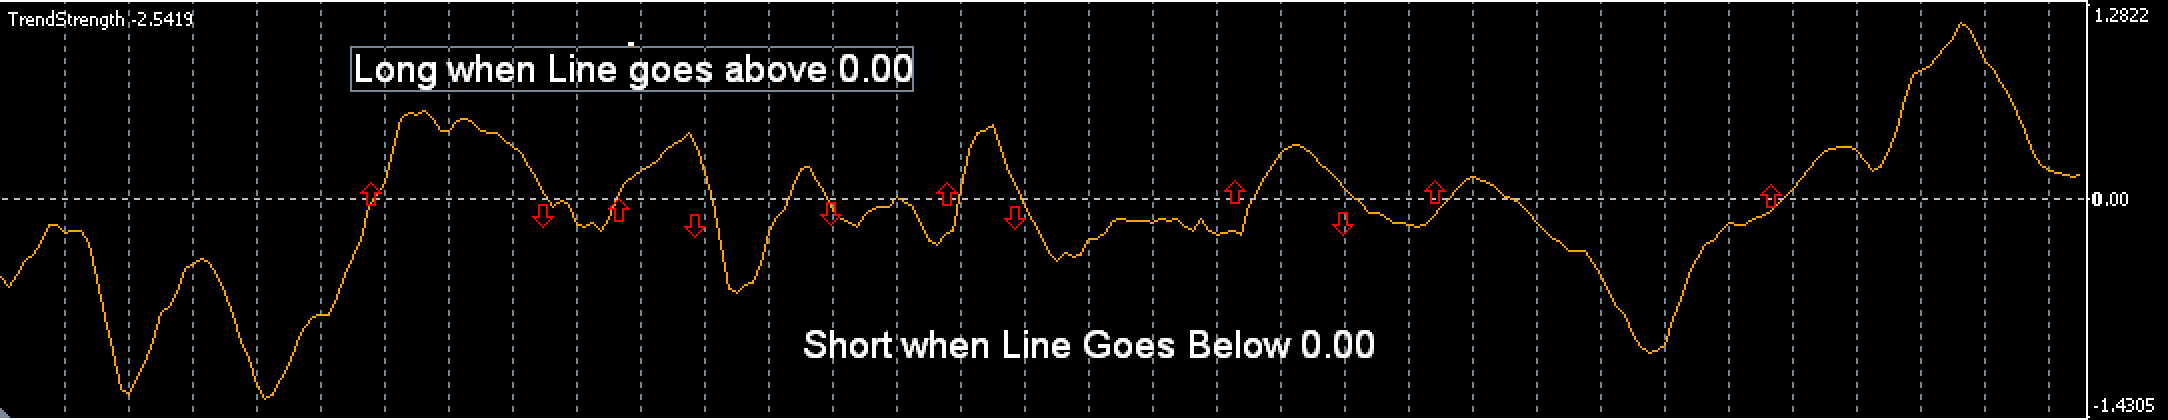
Using the Trend Strength Indicator is straight forward. When the line is above 0.00 level then it means that we are in Bull territory. If the trend strength line is below the 0.00 level, then it’s bearish.
Trend Strength MT4 Indicator Trading Rules
While this Indicator is straight forward and simple to use, it’s more important that you keep to a set of trading rules to keep discipline. We have listed down our rules below for entries and exits. Of course, you can set your own rules. The key to correctly using Indicators successfully and profitably is to use the indicator to find repeating patterns in the Forex pair that you are familiar with.
 Trend Strength MT4 Indicator – Entry Rules
Entry Rule
When the Trend Strength Line crosses above the 0.00 level, it’s time to go long.
When the Trend Strength Line crosses below the 0.00 level, it’s time to go short.
Exit Rule
Exit the trade when you see the Trend Strength line turning the opposite direction.
This exit rule requires a some monitoring especially if you are trading on shorter time frames.
Stop Loss
For long position, use the session low as stop loss.
For short position, use the session high as stop loss.
Be aware that if the session candle is very long, then your risk is higher. You can either skip the trade or enter a smaller lot size. It’s all about risk management first, profit second.
Time Frames
Technically speaking, you can use this indicator for all time frames. However, the shorter the time frame, you will see more fluctuation and possibly more whipsaw which may cause small losses that can eat up your portfolio quickly. We recommend that you use higher time frames like the 4H for better consistency.
Trend Strength MT 4 Indicator Download
We have provided this useful indicator to you at no cost. We humbly request for your help to spread the word by sharing on one of the social platforms below. To unlock the download link, you just need to share this page to help us achieve our goal of helping more traders out there.
[sociallocker id=”6709″]Trend Strength MT4 Indicator Download Link [/sociallocker]
Leave us a comment below to let us know your thoughts on this indicator. If you like this indicator, you might like see other indicators that we have carefully selected that will help you in your trading journey.
Visit our Free MT4 Indicator Download page.
Claim Your $60 No Deposit Bonus Here
All you need is to have your live account verified!
Of course, you need to open a live account...
2 Brokers that we like A LOT!
USD30 from each Forex Broker Below.
Both Forex Brokers have excellent rating!
We use both of these brokers and proudly promote them!
NOTE: Not all countries qualify for these bonuses. Terms and Condition Applies.Other Analysis Today
hello to forex strategy family, I just wanna leave my honest opinion about this indicator Trend Strength Mt4 indicator. I downloaded and loaded it onto my charts on 13 Feb 2016, backtested it, and was able to identify or spot 26 possible trades from all the majors and cross pairs before the market opens at 00:00 GMT +2 (I’m in south africa) and wrote or noted all of them in my diary. I made a quick trade just after the market opened on gbpjpy, and made 800 point or 80 pips, and a quick 100 usd profit and closed and went to bed. i t was the first time testing the strategy live so I didn’t wanna risk anything. I woke up at 06:00 an hour ago to find that 24 of those trade yielded positive pips ranging from 500 to 1500 points (50 to 150 pips) 150 pips on the euraud.
my strategy is simple I use EMAs 5, 10, 20, 50, 100, and 200. stochastic 14,3,3 and The Trend Strength Indicator on the 15 min and 4 hours time frames on different chart windows and SDX_TZPIVOTS indicator. I make entries and exits on the 15 min chart, the 4 hour TF I use it to confirm Trend direction. If the price is below the 100 EMA on the 15 min TF and The Trend Stength is below it’s 0 line as well and price is below the pivot (obviously -LOL), I wait for the stochastic to give a crossover sell signal either then I sell. vise verse for a buy signal.
I’m happy good bye to loosing trades. this is the last piece I needed in my trading I have a 1000 usd in my account right now, I’ll come on Friday to paste my results. I’m very confident this will work.
Thanks to the Forex Strategies Team for your generosity, ever since I’ve following you guys, my game changed every time you paste a new indicator or strategy. but this one is the best for me so far. Thanks To The Trend Stength Indicator, it was the Missing Link to My Trading Gargets. I Love it , and I love and Appreciate your support guys. thanks so much
Great information about indicators. Thank you for making these strategies available.
Awesome to hear this. Practice well on your demo account before going live.