
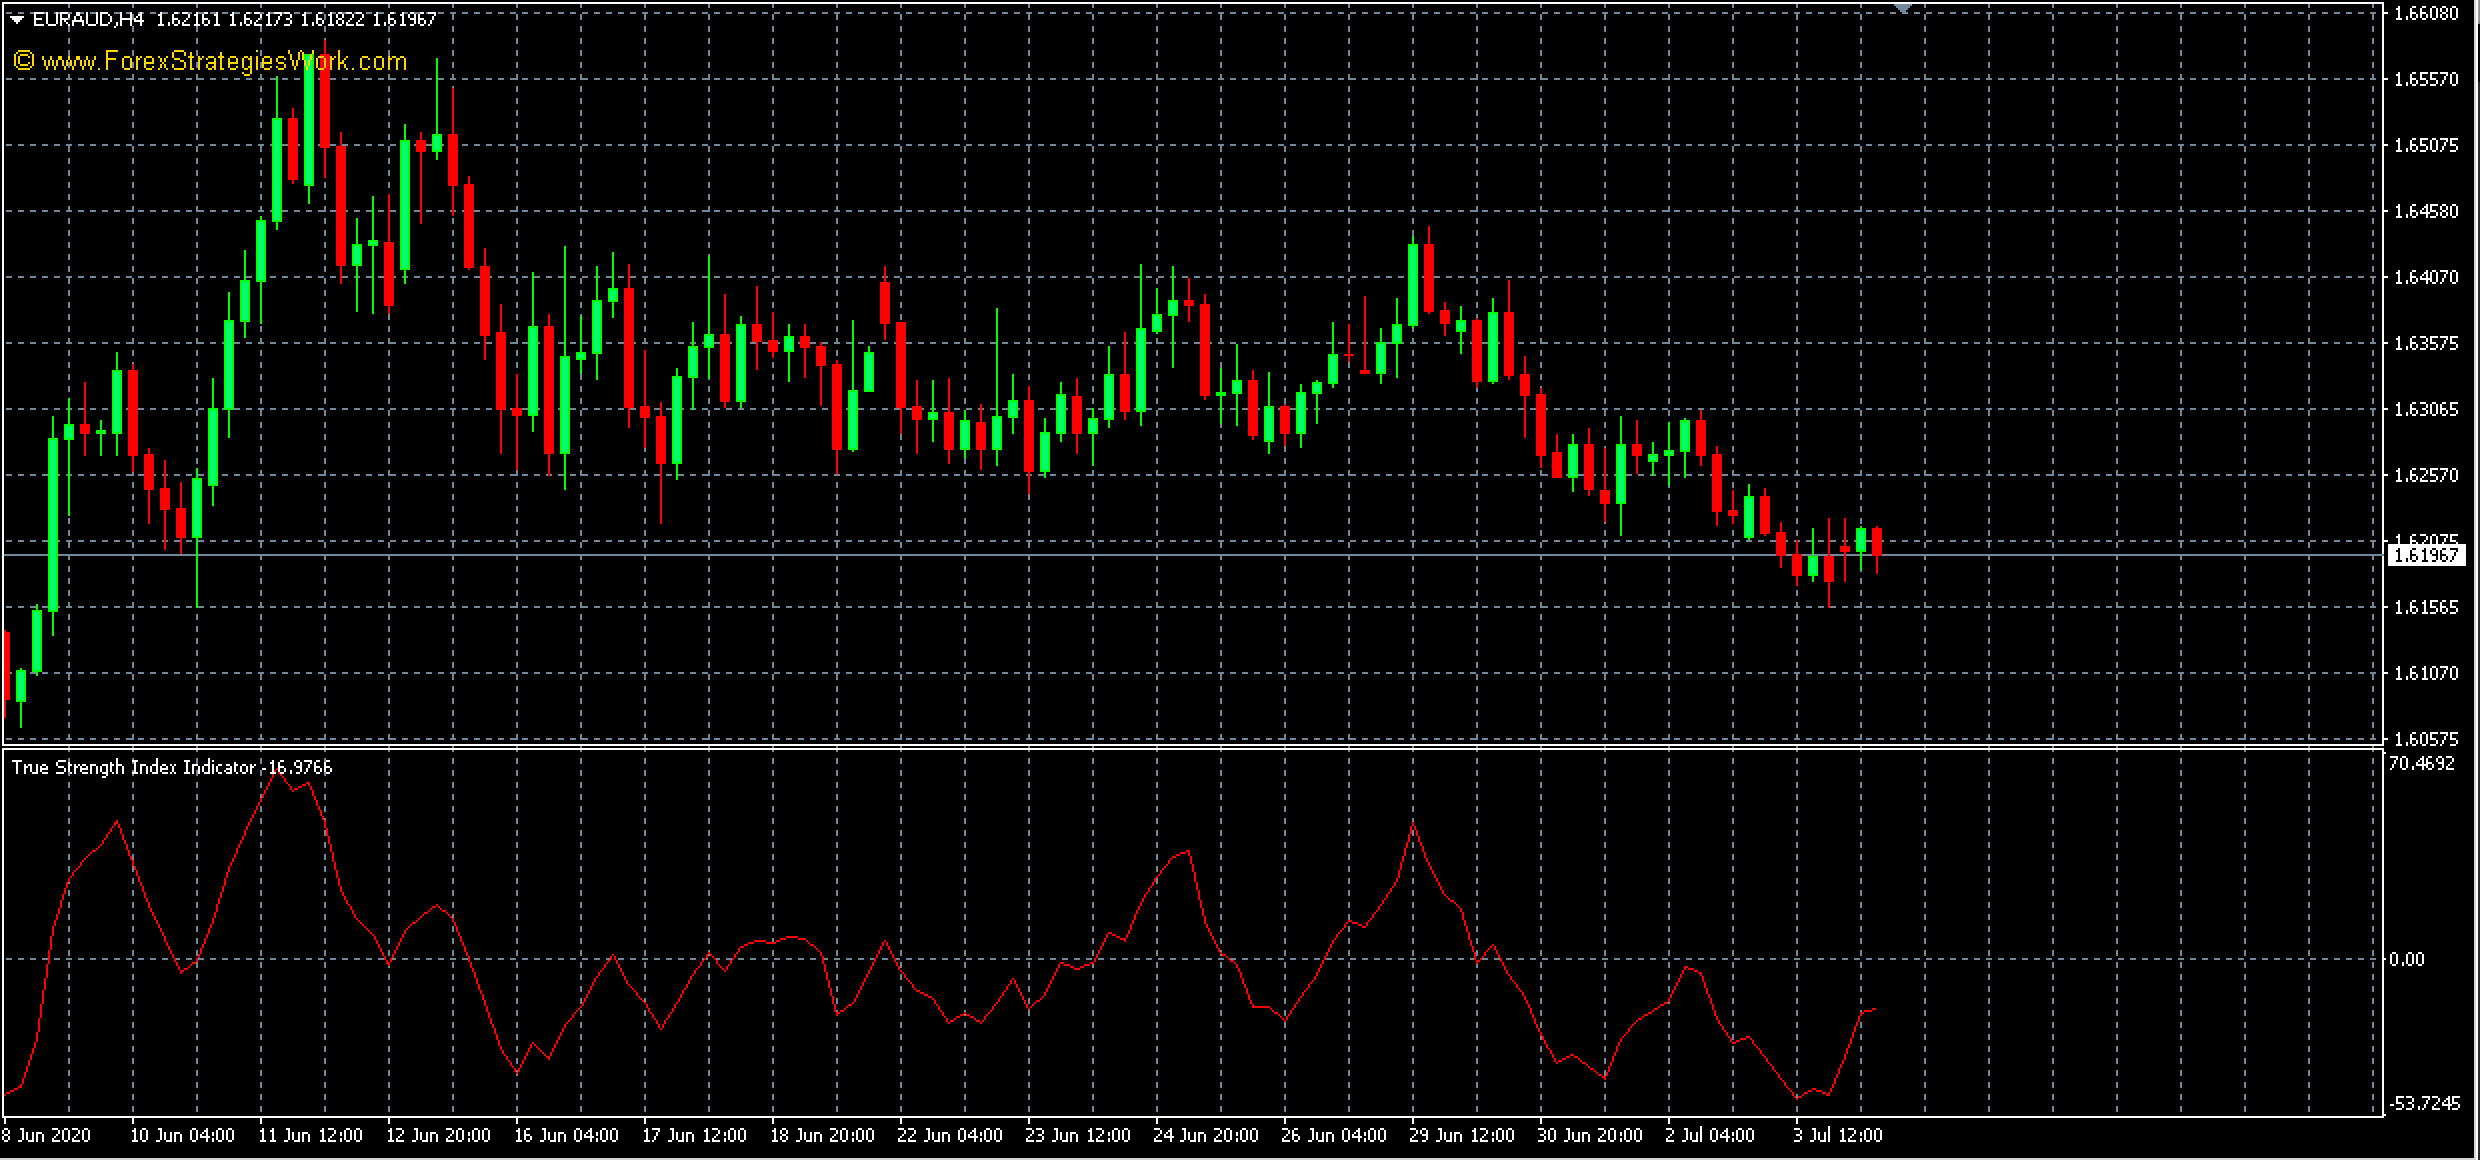
The True Strength Index Indicator MT4 is a custom-built technical indicator that is created to gauge the strength of a trend.

As the name suggests, the True Strength Index Indicator displays the current trend strength.
This indicator rises and falls as and when the momentum in the price rises and falls as well.
When to go long using the True Strength Index Indicator?
Take a long position when you see the True Strength Index Indicator rising.
It is advisable to look at the indicator and see when it is reversing.
Open a long position at the start of a new candlestick.
When to exit your long positions?
Hold the position as long as the True Strength Index Indicator is rising steadily.
Once it crosses over the zero line, watch your position.
Exit the long position when you see the True Strength Index Indicator reversing direction.

When to go short using the True Strength Index Indicator?
Wait for the True Strength Index Indicator to make a high and then reverse direction.
When this happens, open a short position at the next candlestick and continue holding on to the position.
When to exit your short positions?
Hold the position as long as the True Strength Index Indicator is steadily falling.
Once it crosses below the zero line, watch your position.
Exit the short position when you see the True Strength Index Indicator reversing direction and moving higher
Where to set the stop loss?
Stop-loss can be set at the swing high or the swing low point prior to taking a long or short position using the True Strength Index Indicator.
Conclusion
The True Strength Index Indicator, as the name suggests indicates the strength of the trend.
This can signal to you whether the trend will continue or not.
We recommend using the True Strength Index Indicator along with moving averages to confirm the bullish and bearish crossovers and the resulting trends.
How to Increase Your Winning Ratio with the True Strength Index Indicator MT4?
When you add the True Strength Index Indicator and use it together with a proven trend trading system like the Elite Swing Trader or Simple Trend Trading System, you can only expect to achieve a better win ratio and better risk-reward ratio.
Recommended Time Frames
Technically speaking, you can use this MT4 indicator for all time frames.
However, the shorter the time frame, you will see more fluctuation and possibly more whipsaw which may cause small losses that can eat up your portfolio quickly.
We recommend that you use higher time frames like the H4 or even higher for better consistency.
Click Here for Your Free Download of True Strength Index Indicator.ex4 file
How to Install Custom Indicators on MT4 on Windows
How to Install Custom Indicators on MT4 on Mac OS
FREE Metatrader 4 Download | Free MT4 Download
Visit our Free MT4 Indicator Download page.
We hope you have enjoyed this post as much as we have created this strategy post for you.
Good luck and thank you for your readership.
Claim Your $60 No Deposit Bonus Here
All you need is to have your live account verified!
Of course, you need to open a live account...
2 Brokers that we like A LOT!
USD30 from each Forex Broker Below.
Both Forex Brokers have excellent rating!
We use both of these brokers and proudly promote them!
NOTE: Not all countries qualify for these bonuses. Terms and Condition Applies.Other Analysis Today