USD/JPY Daily Price Forecast – 17th January 2025

USD/JPY Daily Price Forecast – 17th January 2025

If you like our trade signals, join us on our PREMIUM TELEGRAM CHANNEL.

117% ROI in ONLY 10 days. Join our Facebook Group to learn more.

a blue and white logo


USD/JPY Daily Price Forecast – 17th January 2025

Trade Summary:

USDJPY
Buy Stop @ 155.690
TP @ 156.113
SL @ 154.948

Detailed Analysis of the USD/JPY H4 Chart:

1. Overview of the Trade Setup:

  • Instrument: USD/JPY (H4 timeframe)

  • Buy Stop Level155.690

  • Stop Loss (SL)154.948

  • Take Profit (TP)156.113

This trade setup is based on a bullish momentum confirmation, with the price positioned near a key support level and showing signs of a potential upward continuation.


2. Key Technical Indicators:
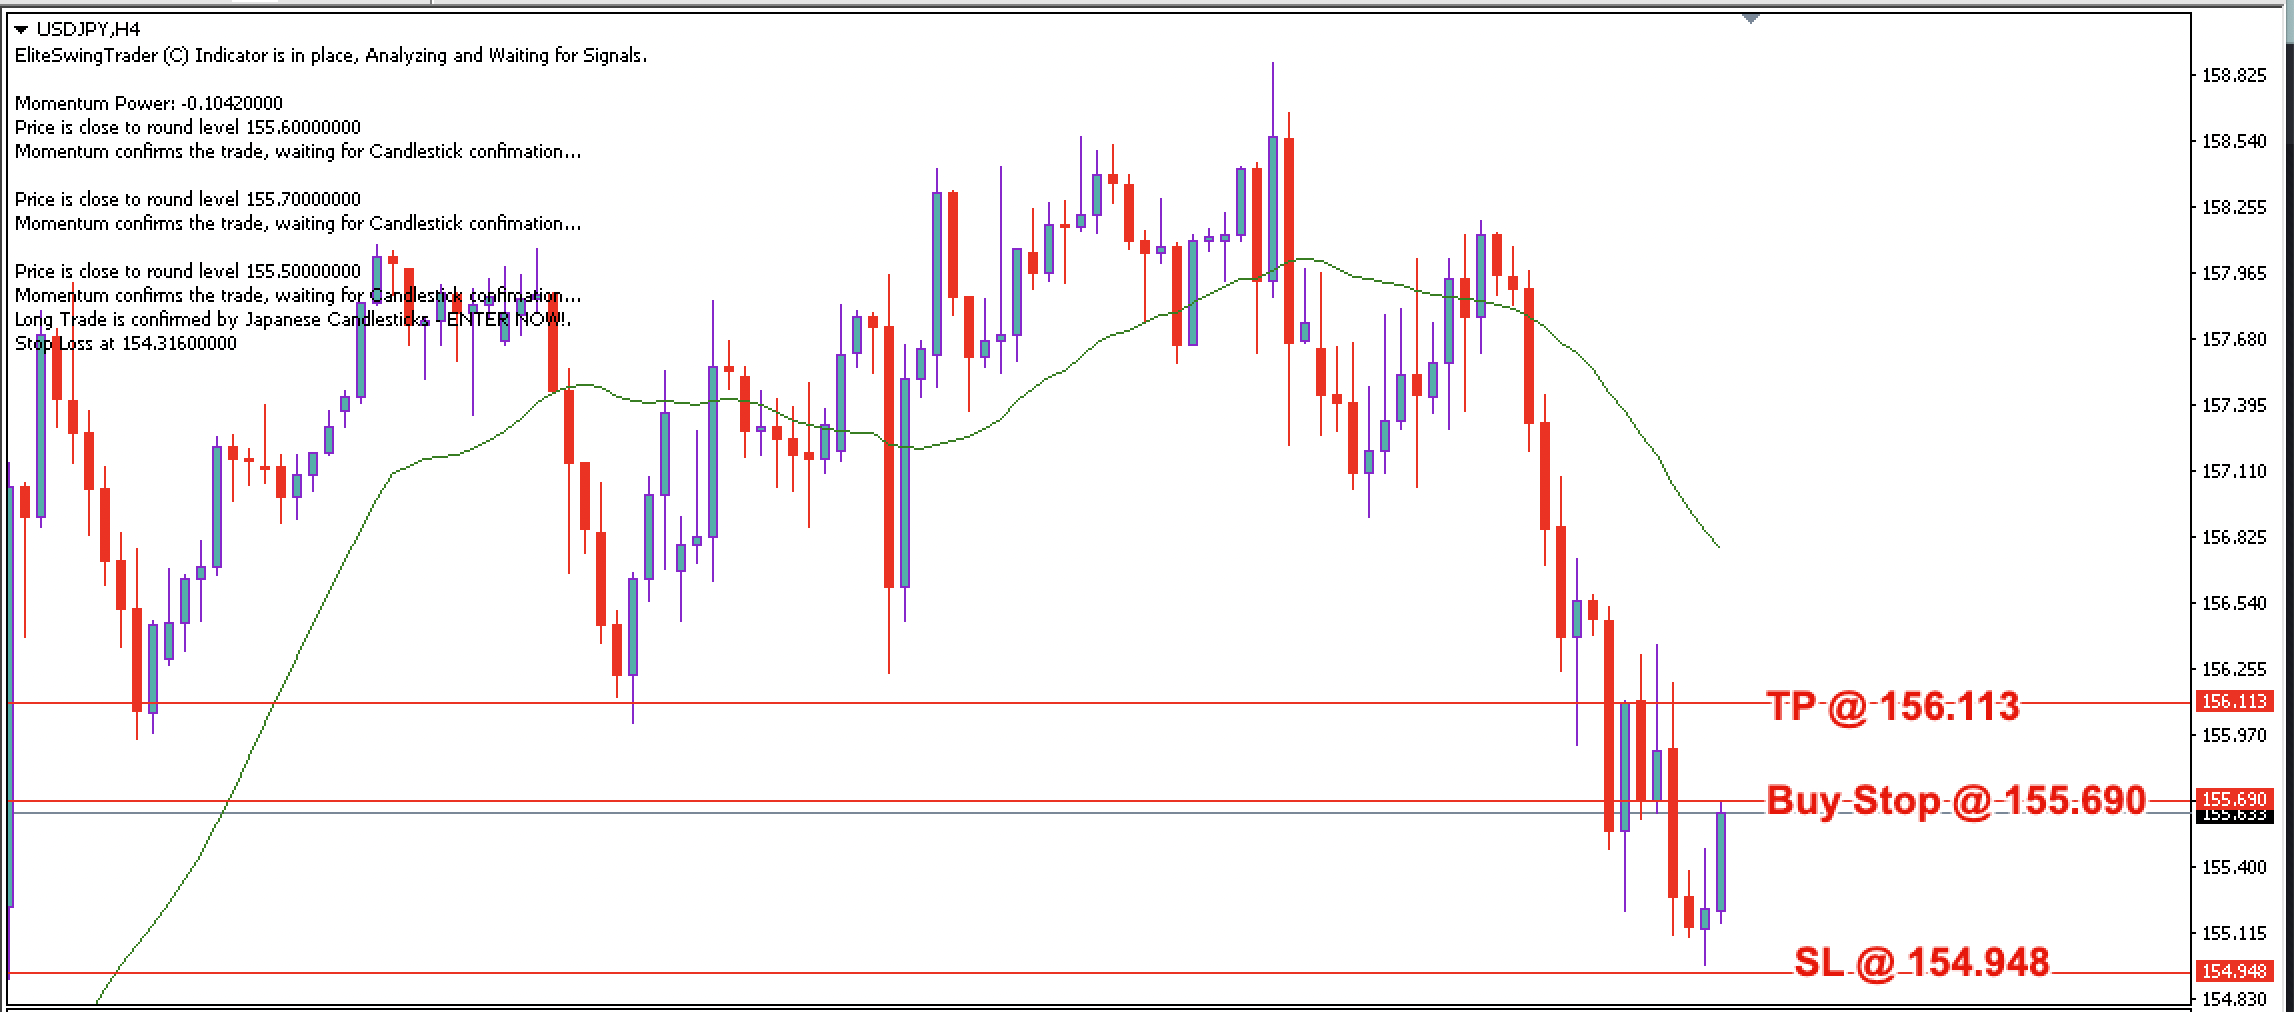
  • Momentum Power:

    • The momentum power is negative (-0.10420000), indicating bearish sentiment. However, the chart suggests a potential reversal as the price approaches a key support level.

  • Price Action:

    • The price is close to the 155.500 round level, which is a significant psychological level. A break above 155.690 would confirm bullish momentum.

    • The candlestick patterns show rejection of lower prices, with buyers stepping in near the support zone.

  • Moving Averages:

    • The price is below the 200-period moving average (green line), indicating a bearish trend. However, the recent price action suggests a potential retracement or reversal.

    • The moving average is sloping downward, but the price is attempting to break higher.

  • Support and Resistance Levels:

    • Support: The support level at 154.948 (SL) is well-placed below recent lows, allowing room for minor retracements.

    • Resistance: The resistance level at 156.113 (TP) aligns with previous price action and a potential supply zone.


3. Risk-to-Reward Ratio:

  • Risk: The distance between the Buy Stop and the Stop Loss is 74.2 pips (155.690 – 154.948).

  • Reward: The distance between the Buy Stop and the Take Profit is 42.3 pips (156.113 – 155.690).

  • Risk-to-Reward Ratio: Approximately 1:0.57. While the risk-to-reward ratio is not ideal, the trade is valid due to the potential for a bullish breakout.

See also  AUD/CAD Daily Price Forecast – 2nd February 2024

4. Trade Justification:

  • Bullish Momentum:

    • The price action near the 155.500 round level suggests a strong likelihood of a bullish breakout.

    • The chart indicates a long trade confirmation, aligning with the buy stop order.

  • Trend Alignment:

    • While the price is below the 200-period moving average, the candlestick patterns and support levels suggest a potential reversal or retracement.

  • Logical Stop Loss and Take Profit:

    • The Stop Loss is placed below the recent support level, allowing for minor retracements without invalidating the trade.

    • The Take Profit is placed at a logical resistance level, ensuring a realistic target.


5. Potential Risks:

  • False Breakout: If the price fails to sustain above 155.690, the trade could be invalidated.

  • Market Volatility: Sudden news or events could cause unexpected price movements.


6. Summary of the Trade Setup:

  • Buy Stop155.690 (above key resistance level to confirm bullish momentum).

  • Stop Loss (SL)154.948 (below recent support to allow for retracements).

  • Take Profit (TP)156.113 (at a logical resistance level).

This trade setup aligns with the potential for a bullish reversal, offering an opportunity to profit from a retracement or continuation of the upward move. However, the risk-to-reward ratio should be carefully considered before execution.

Recommended Lot Size

Trading is all about statistics.

While we can experience winning streaks, we can also suffer from losing streaks.

As such, we should always size each trade to withstand losing streaks (if any).

It’s widely recommended that you should not risk more than 2% of your capital for each trade.

We believe it’s easier to control your lot size by limiting your lot sizing to 0.01 for every $500 in your account.

See also  GBPUSD Weekly Forex Forecast - 13th to 17th Mar 2017

So if you have $5000, then risk no more than 0.10 lot size per trade.

*****************

If you spot a mistake especially when it comes to the price, please use common sense and check the chart.

We wish you good luck and good profit for this trade idea.

For more trade ideas, join the Price Action Society

Start with a $30 trading bonus

Trade forex and CFDs on stock indices, commodities, stocks, metals, and energies with these licensed and regulated brokers.

For all clients who open their first real account, these brokers offer a $30 trading bonus to test their products and services without any initial deposit needed.

Learn more about how you can trade over 1000 instruments on their MT4 and MT5 platforms from your PC and Mac, or from a variety of mobile devices.

a white background with a black line

http://www.priceactionsociety.com


If you like our analysis and would like to receive 3 to 7 trade ideas per day, then
Click here to learn more about the Price Action Society.


Claim Your $60 No Deposit Bonus Here

All you need is to have your live account verified!
Of course, you need to open a live account...

2 Brokers that we like A LOT!
USD30 from each Forex Broker Below.
Both Forex Brokers have excellent rating!

Broker #1

Broker #2

We use both of these brokers and proudly promote them!

NOTE: Not all countries qualify for these bonuses. Terms and Condition Applies.

Other Analysis Today

Tags


You may also like

Leave a Reply

Your email address will not be published. Required fields are marked *

{"email":"Email address invalid","url":"Website address invalid","required":"Required field missing"}

Direct Your Visitors to a Clear Action at the Bottom of the Page

Advanced Forex Strategies