
Before you continue, we want to make sure you understand that this is a past trade idea found inside The Price Action Club which is a premium Price Action trade signal service. This post is 1 week delayed and this idea is no longer valid but the lesson is still valid. We post this to show you what is inside the Price Action Club. It would be awesome if you join us to learn and to trade our trade ideas. We hope to see you inside the Price Action Club soon. Click here to join us…

[thrive_link color=’green’ link=’https://www.forexstrategieswork.com/the-price-action-club/’ target=’_blank’ size=’big’ align=’aligncenter’]Join The Price Action Club Here…[/thrive_link]
USDCAD Price Action Analysis – 31st May 2017
USDCAD has been down trending on the H4 chart. In fact, the price has been within a down trending channel, which has been obeyed by the price number of times. By looking at the price behavior, I assume that the down trending channel is going to play an important part on USDCAD. Yesterday the price had another rejection from the resistance of that channel. It means going short would be able to offer an excellent risk and reward ratio. Let us have a look at the chart and the channel…
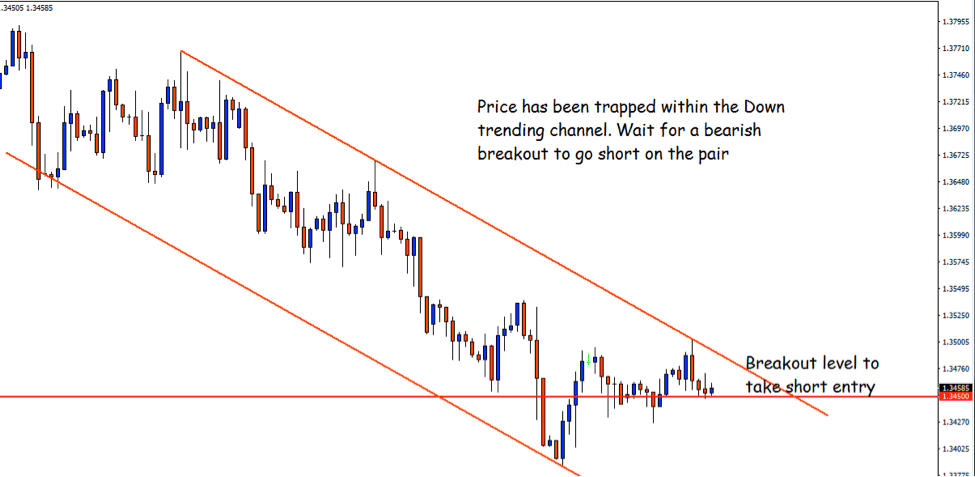
Have a look at the down trending channel’s resistance lines. The price obeyed it three times so far. Yesterday the resistance line produced another solid bearish candle. This is an indication that the price would come down to make new lower lows. Here we should wait for a breakout at 1.34500, which is today’s lower low as well. Let us have a look at the summary of the trade…
- Sell Stop Order: 1.34500
- Stop Loss Level: 1.35000
- Take Profit Target: 1.33500
- Validity: 24 hours
- Whenever possible, move the stop loss to the entry price and whenever you want, you can take profit anytime as long as you feel comfortable
Trend line plays an important part in price action trading. However, drawing a trendline alone can be deceptive. On the contrary, if we draw channel, we would be able to find the support or resistance lines easily where the price is going to react. The charts do not always give us the opportunity to draw channel though. However, we should always keep our eyes on the chart whether we are able to draw a channel.
You can also take a look at our previous (and most likely profitable) Free Forex Trading Signals Here.
We hope that you enjoy our Free Forex Trading Signal today: USDCAD Price Action Analysis – 31st May 2017
[thrive_link color=’green’ link=’https://www.forexstrategieswork.com/the-price-action-club/’ target=’_blank’ size=’big’ align=’aligncenter’]Join The Price Action Club Here…[/thrive_link]
Claim Your $60 No Deposit Bonus Here
All you need is to have your live account verified!
Of course, you need to open a live account...
2 Brokers that we like A LOT!
USD30 from each Forex Broker Below.
Both Forex Brokers have excellent rating!
We use both of these brokers and proudly promote them!
NOTE: Not all countries qualify for these bonuses. Terms and Condition Applies.Other Analysis Today