
Before you continue, we want to make sure you understand that this is a past trade idea found inside The Price Action Club which is a premium Price Action trade signal service. This post is 1 week delayed and this idea is no longer valid but the lesson is still valid. We post this to show you what is inside the Price Action Club. It would be awesome if you join us to learn and to trade our trade ideas. We hope to see you inside the Price Action Club soon. Click here to join us…

[thrive_link color=’green’ link=’https://www.forexstrategieswork.com/the-price-action-club/’ target=’_blank’ size=’big’ align=’aligncenter’]Join The Price Action Club Here…[/thrive_link]
USDCAD Price Action Analysis – 3rd July 2017
USDCAD has been bearish on the H4 and the Daily chart. The price breached a significant level of support at 1.30000 as well on its bearish journey. Thus, we are going to wait for a breakout towards the South to take a short entry. Let us find out those levels that we need to keep our eyes on.
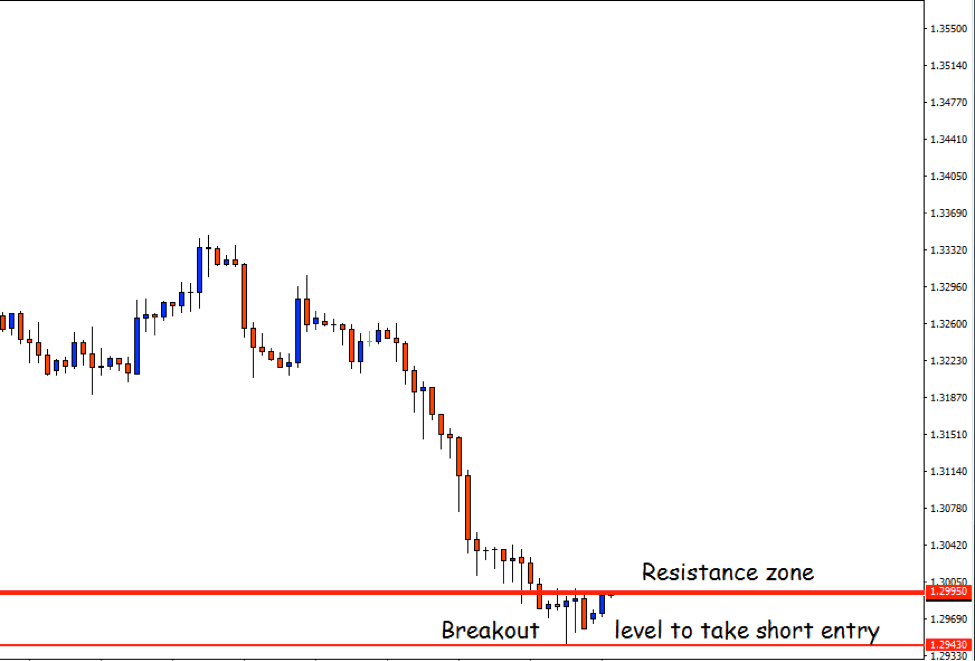
As we see on the H4 chart, the price has been bearish and kept making lower lows. It came down up to the level of 1.29430 and then started having correction. The level of 1.29950 has been acting as a level of resistance so far. If the price produces an H4 Engulfing candle from that zone, then sellers would have to wait for a breakout at 1.29430 to take a short entry. An H4 breakout would be excellent. If we do not get an H4 breakout, then an H1 breakout after an H4 reversal candle would be good enough to take a short entry as well. Let us have a look at the summary of the trade…
- Sell Stop Order: 1.29430
- Stop Loss Level: above 1.30100
- Take Profit Target: 1.28600
- Validity: 72 hours
- Whenever possible, move the stop loss to the entry price and whenever you want, you can take profit anytime as long as you feel comfortable
The price has been reacting at 1.29950 so far, but there is a huge demand that the price could go up to 1.30000. Then, it might produce the H4 reversal candle. That is why the level is marked as Resistance zone on the chart. All we are going is to wait for an H4 reversal candle on that zone, then a breakout to take the entry.
You can also take a look at our previous (and most likely profitable) Free Forex Trading Signals Here.
We hope that you enjoy our Free Forex Trading Signal today: USDCAD Price Action Analysis – 3rd July 2017
[thrive_link color=’green’ link=’https://www.forexstrategieswork.com/the-price-action-club/’ target=’_blank’ size=’big’ align=’aligncenter’]Join The Price Action Club Here…[/thrive_link]
Claim Your $60 No Deposit Bonus Here
All you need is to have your live account verified!
Of course, you need to open a live account...
2 Brokers that we like A LOT!
USD30 from each Forex Broker Below.
Both Forex Brokers have excellent rating!
We use both of these brokers and proudly promote them!
NOTE: Not all countries qualify for these bonuses. Terms and Condition Applies.Other Analysis Today