This trade setup is based on a combination of technical analysis, momentum confirmation, and price action. Below is a detailed breakdown of the justification for this trade:
1. Technical Analysis
Key Levels
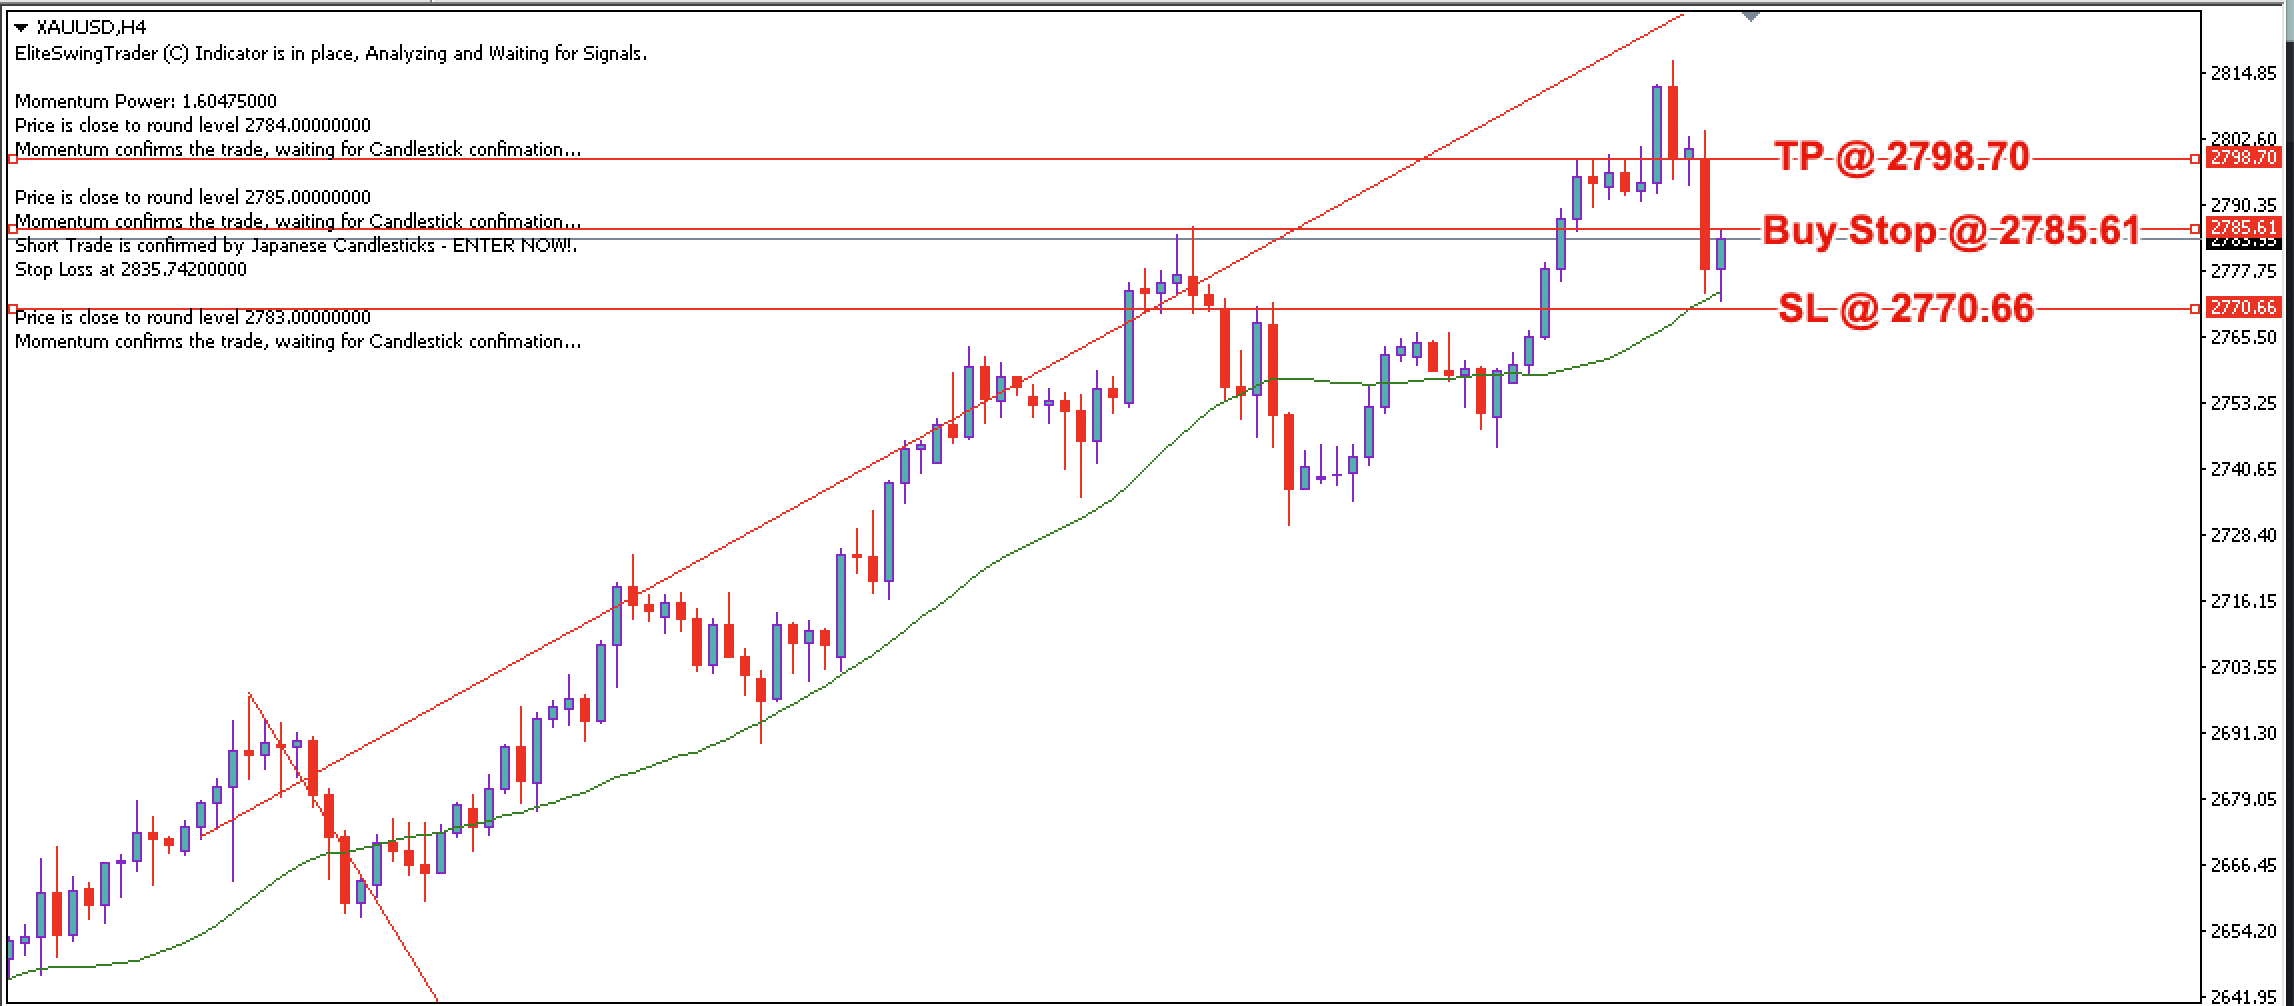
Support Level: The price has shown strong support near the 2770.00 level, as evidenced by previous price rejections. The stop loss is placed slightly below this level at 2770.66 to account for potential false breakouts.
Resistance Level: The 2785.00 level is a significant resistance zone, and the buy stop order at 2785.61 ensures entry only if the price breaks above this level, confirming bullish momentum.
Take Profit Level: The TP is set at 2798.70, slightly below the next resistance level, ensuring a realistic and achievable target.
Trend Analysis
The price is trading above the 50-period moving average (green line), which is acting as dynamic support. This indicates a bullish trend, and the trade aligns with the prevailing market direction.
The recent pullback to the moving average suggests a potential continuation of the upward trend.
Price Action
The price is consolidating near the 2785.00 level, forming a potential bullish continuation pattern. The buy stop order ensures entry only if the price breaks above this consolidation zone, confirming the continuation of the uptrend.
The momentum indicator shows a value of 1.60475000, indicating strong bullish pressure in the market. This aligns with the trade direction and supports the likelihood of an upward move.
The chart notes confirm that momentum is in favor of the trade, awaiting candlestick confirmation for execution.
3. Risk-Reward Ratio
Stop Loss (SL): Placed at 2770.66, below the recent support level and the 2770.00 round number. This ensures protection against false breakouts while allowing the trade room to breathe.
Take Profit (TP): Set at 2798.70, slightly below the next resistance level. This level aligns with the next logical resistance zone, providing a realistic target.
Risk-Reward Ratio:
Risk: 14.95 (2785.61 – 2770.66)
Reward: 13.09 (2798.70 – 2785.61)
Risk-Reward Ratio: ~1:0.87. While the risk-reward ratio is slightly less than 1:1, the high probability of success based on technical and momentum analysis justifies the trade.
4. Candlestick Confirmation
The trade setup is waiting for a bullish candlestick breakout above the 2785.61 level. This ensures that the trade is executed only when there is clear evidence of buying pressure.
5. Psychological and Round Numbers
The levels chosen (2770.00, 2785.00, and 2798.00) are psychological round numbers, which often act as key support and resistance zones in forex trading. These levels are likely to attract significant market activity, increasing the probability of the trade’s success.
6. Trade Justification
Bullish Momentum: The momentum indicator confirms the trade direction, suggesting that the price is likely to move higher.
Breakout Potential: The buy stop order ensures entry only if the price breaks above the consolidation zone, reducing the risk of false signals.
Logical Stop Loss and Take Profit: The SL and TP levels are strategically placed to balance risk and reward while aligning with key technical levels.
Confluence of Factors: The trade setup is supported by multiple factors, including momentum, moving averages, psychological levels, and candlestick patterns.
This trade is justified based on the confluence of technical analysis, momentum confirmation, and logical risk-reward management. The buy stop order ensures entry only if the price breaks above the consolidation zone, confirming bullish momentum. The SL and TP levels are well-placed to protect against losses and capture potential gains, making this a high-probability trade setup.
Recommended Lot Size
Trading is all about statistics.
While we can experience winning streaks, we can also suffer from losing streaks.
For all clients who open their first real account, these brokers offer a $30 trading bonus to test their products and services without any initial deposit needed.