7 HIGH PROFIT CANDLESTICK PATTERNS PDF | PDF Download Link
7 high profit candlestick patterns PDF
Candlestick patterns are an important tool for traders, as they provide valuable insights into market trends and potential price movements. In this article, we will explore seven high-profit candlestick patterns that can help traders identify profitable opportunities in the market.
Hammer: The hammer is a bullish reversal pattern that indicates a potential trend reversal from a bearish to a bullish market. It features a small real body and a long lower shadow, which suggests that buyers are starting to push prices higher.
Hanging Man: The hanging man is a bearish reversal pattern that signals a potential trend reversal from a bullish to a bearish market. It has a small real body and a long lower shadow, indicating that sellers are starting to take control of the market.
Doji: The doji is a neutral pattern that indicates a potential trend reversal. It features a small real body with long upper and lower shadows, suggesting that the market is indecisive.
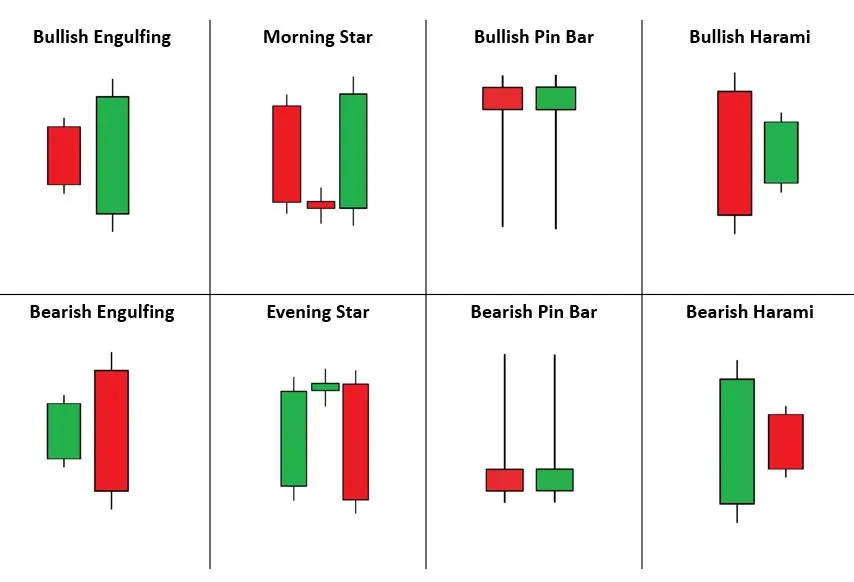
Bullish Engulfing: The bullish engulfing pattern is a bullish reversal pattern that features a small real body and a long lower shadow, followed by a larger real body that completely engulfs the previous candle. It indicates a potential trend reversal from bearish to bullish.
Bearish Engulfing: The bearish engulfing pattern is a bearish reversal pattern that features a small real body and a long upper shadow, followed by a larger real body that completely engulfs the previous candle. It indicates a potential trend reversal from bullish to bearish.
Three White Soldiers: The three white soldiers pattern is a bullish reversal pattern that features three consecutive long white candles with small or non-existent shadows. It indicates a potential trend reversal from bearish to bullish.
Three Black Crows: The three black crows pattern is a bearish reversal pattern that features three consecutive long black candles with small or non-existent shadows. It indicates a potential trend reversal from bullish to bearish.
By understanding and recognizing these high-profit candlestick patterns, traders can make informed trading decisions and identify profitable opportunities in the market. However, it is important to remember that no pattern is foolproof, and traders should always use additional analysis and risk management techniques to ensure successful trades.
So go ahead and download. It's FREE!
7 HIGH PROFIT CANDLESTICK PATTERNS PDF Download Link
Free Download Link Below
The Habit Poem I am your constant companion.
I am your greatest helper or heaviest burden.
I will push you onward or drag you down to failure.
I am completely at your command.
Half of the things you do you might as well turn over to me and I will do them - quickly and correctly.
I am easily managed - you must be firm with me.
Show me exactly how you want something done and after a few lessons, I will do it automatically.
I am the servant of great people, and alas, of all failures as well.
Those who are great, I have made great.
Those who are failures, I have made failures.
I am not a machine though I work with the precision of a machine plus the intelligence of a person.
You may run me for profit or run me for ruin - it makes no difference to me.
Take me, train me, be firm with me, and I will place the world at your feet.
Be easy with me and I will destroy you.
CAD/CHF Daily Price Forecast – 12th December 2025 If you like our trade signals, join us on our PREMIUM TELEGRAM CHANNEL. 117% ROI in ONLY 10 days. Join our Facebook Group to learn more. Trade Summary: CADCHFBuy Stop @ 0.57778TP @ 0.58045SL @ 0.57534 ________________________ CAD/CHF Daily Price Forecast – 12th
AUD/CAD Daily Price Forecast – 9th December 2025 If you like our trade signals, join us on our PREMIUM TELEGRAM CHANNEL. 117% ROI in ONLY 10 days. Join our Facebook Group to learn more. Trade Summary: AUDCADSell Stop @ 0.91848TP @ 0.91710SL @ 0.92054 ________________________ AUD/CAD Daily Price Forecast – 9th